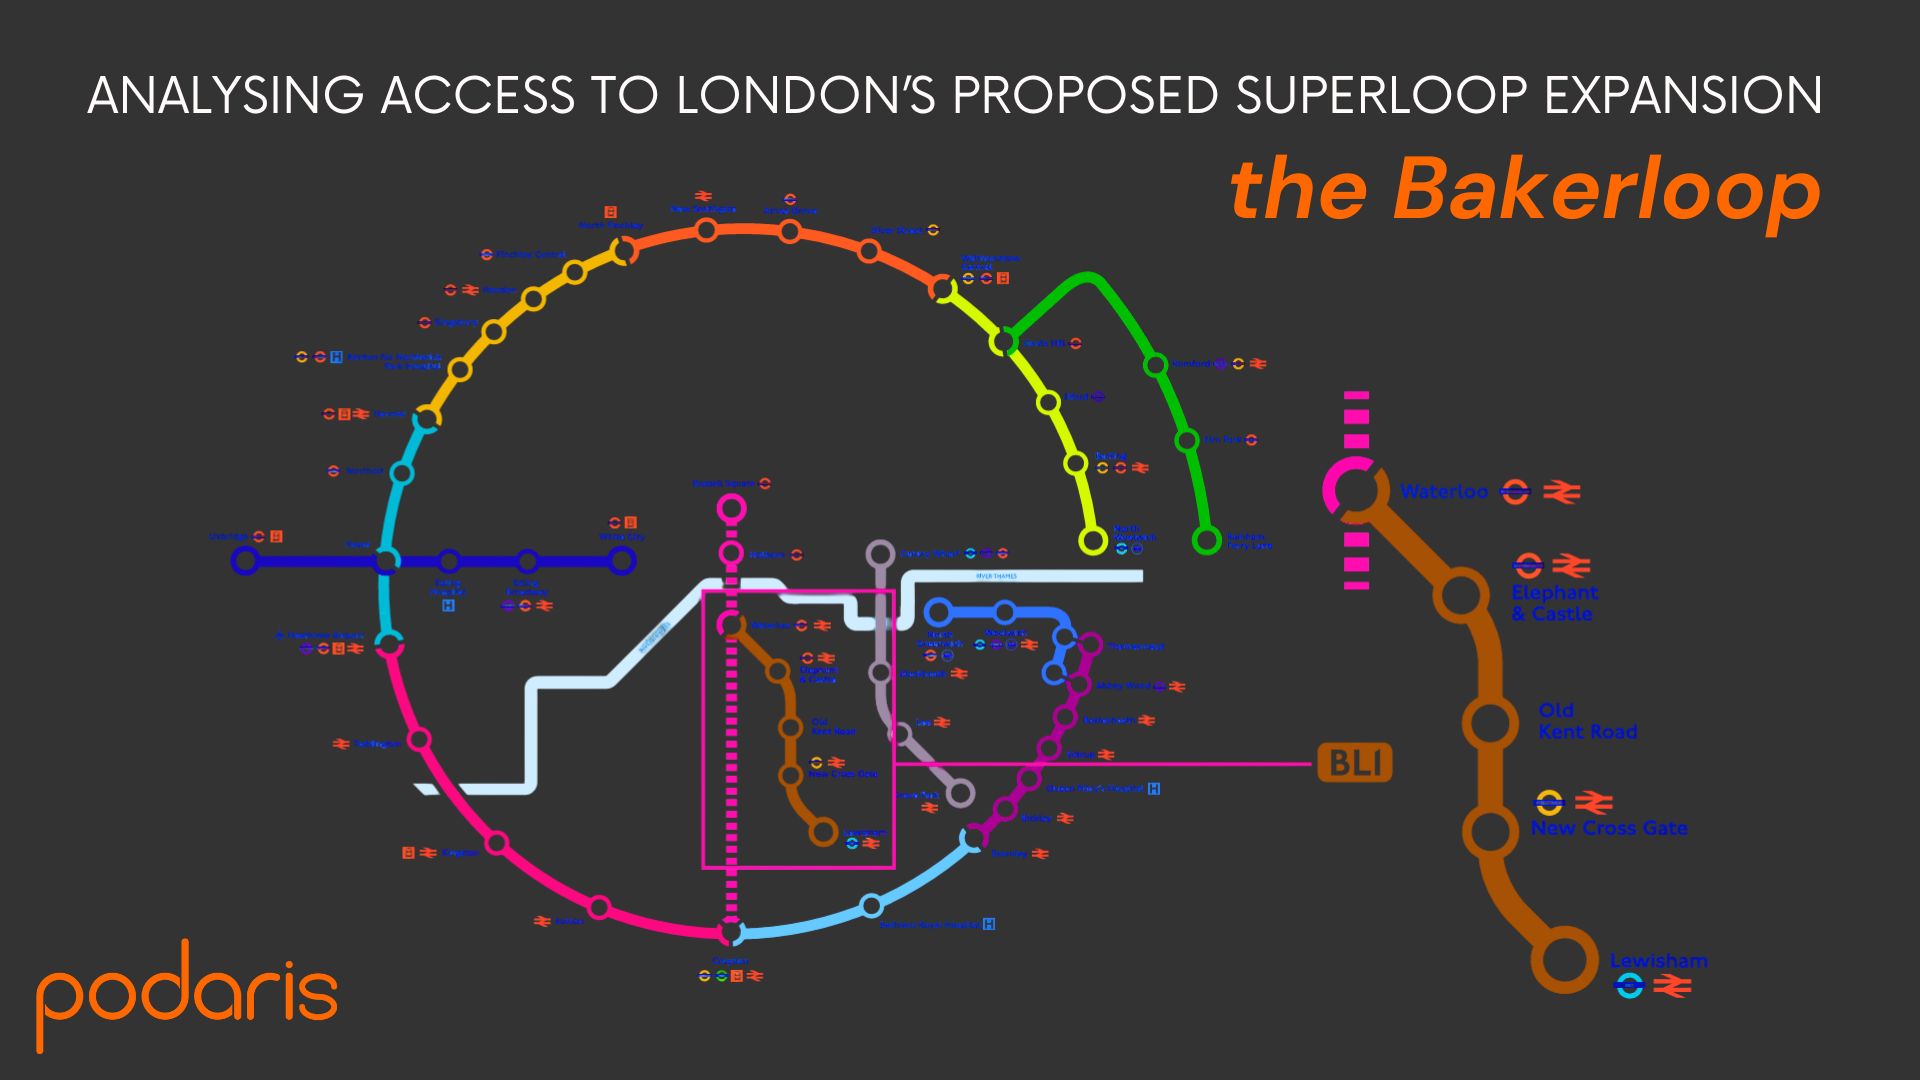
The BL1 route, also known as the Bakerloop, is a proposed express bus service that would run between Waterloo, Elephant & Castle, and Lewisham town centre. It is part of Transport for London’s (TfL) Superloop expansion, a network of express bus routes aimed at improving connectivity, particularly in outer London.
TfL has launched a public consultation on the BL1 route, which runs until 14 March 2025. If approved, the BL1 service is expected to launch in autumn 2025.
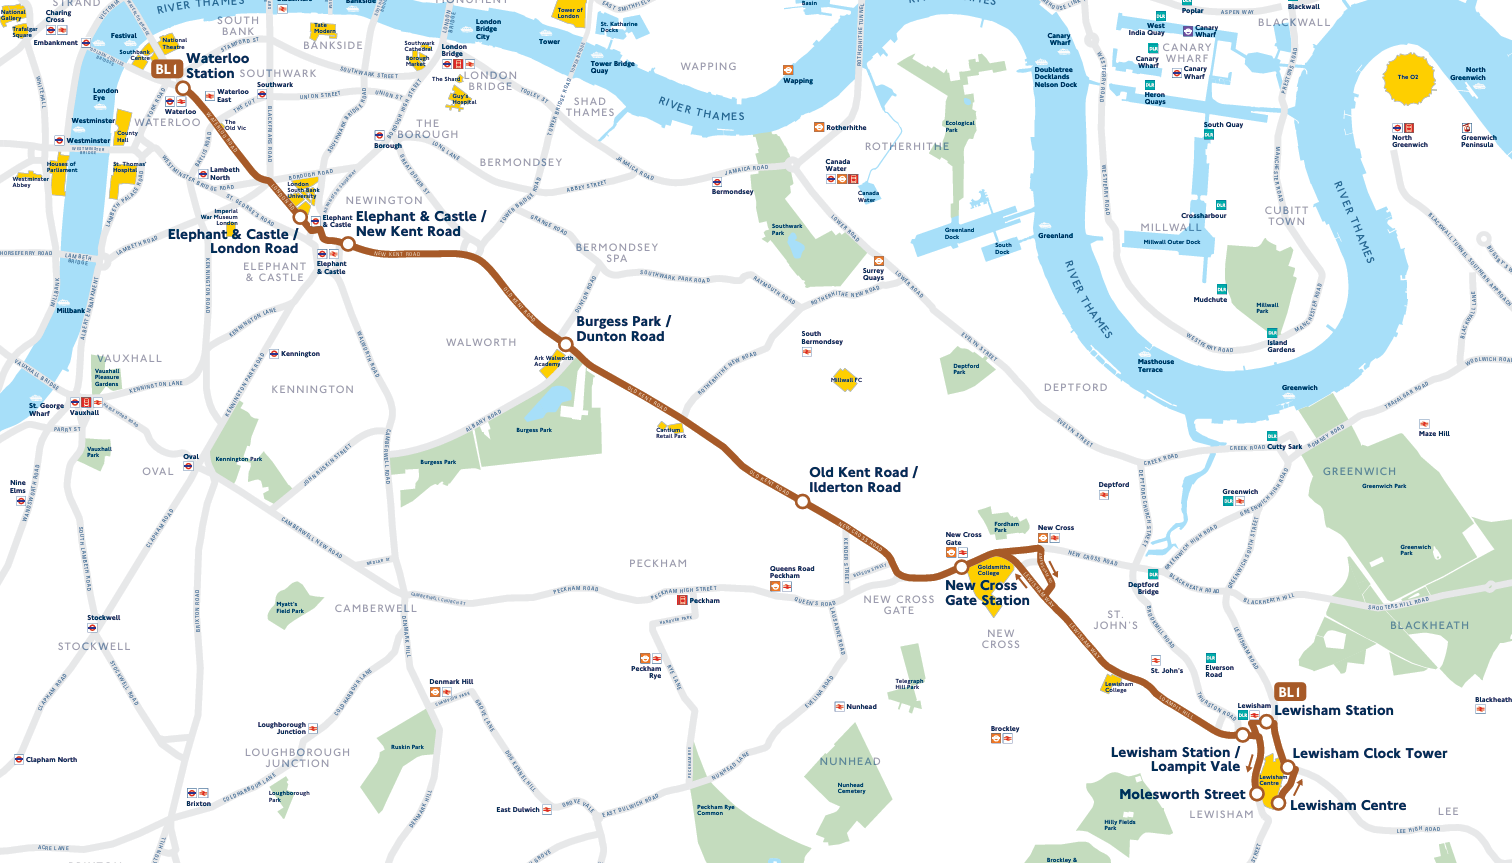
The proposed Bakerloop express bus route (Credit: TfL)
What are the Superloop and Bakerloop?
The Superloop is a network of express bus routes introduced by TfL in 2023, designed to provide faster journeys across outer London, linking key locations like town centres, hospitals, schools, and transport hubs.
The first phase has already been implemented, and now TfL is consulting on its expansion, which includes three additional routes:
- BL1 (Bakerloop): Waterloo – Lewisham
- SL11: North Greenwich – Abbey Wood (via Woolwich)
- SL12: Gants Hill – Rainham (via Romford)
These routes aim to improve public transport connectivity and support regeneration projects, before long-term infrastructure projects like the Bakerloo line extension are completed.
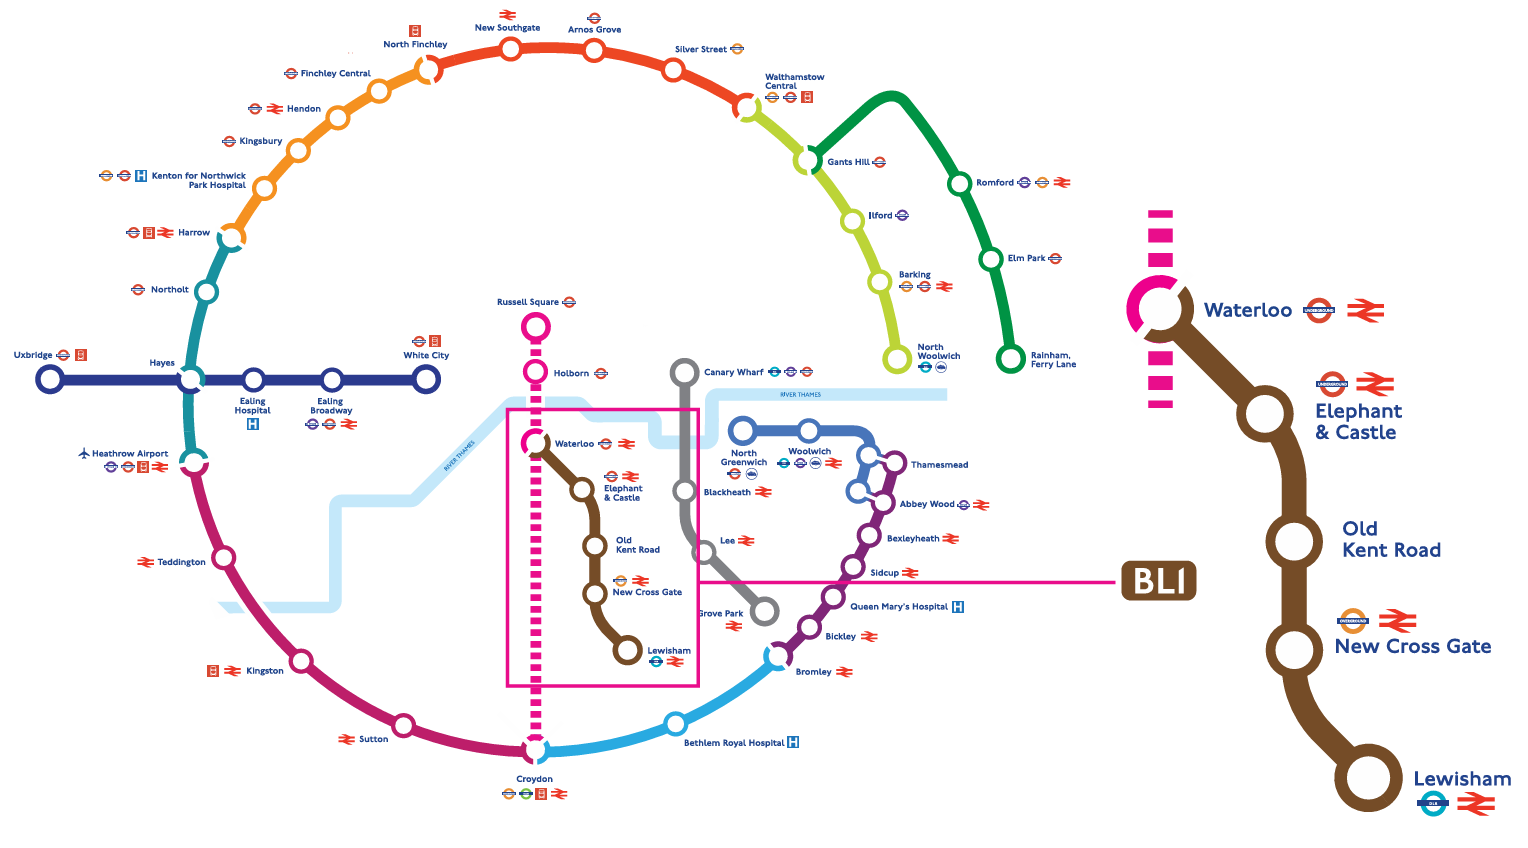
The proposed expansion to the Superloop (Credit: TfL)
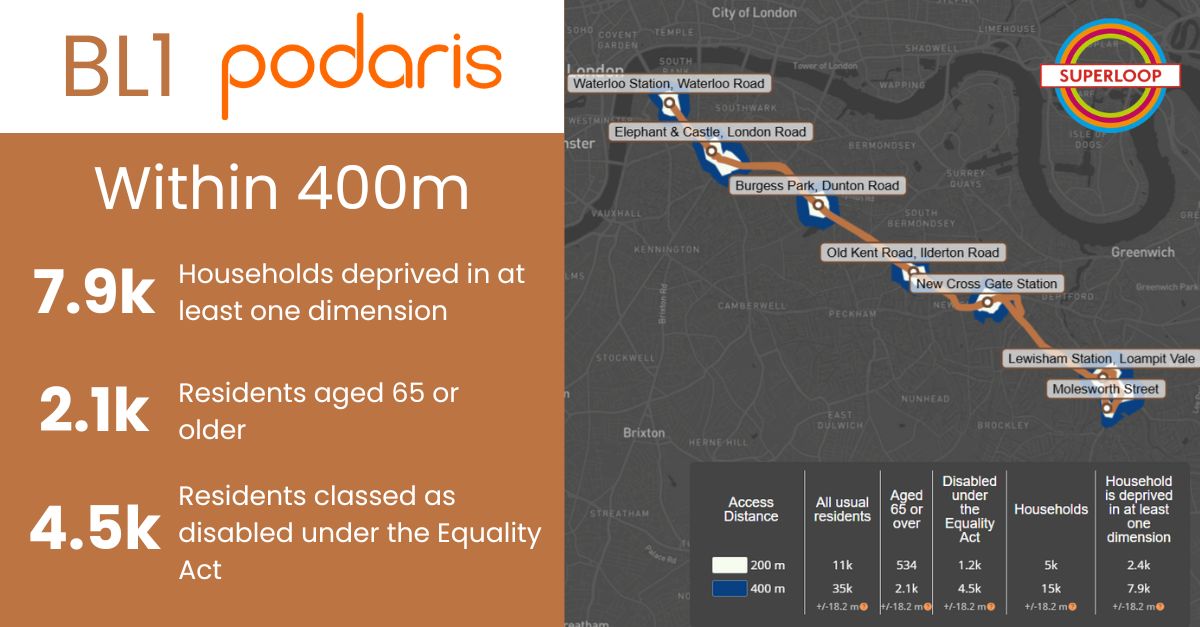
Using the information provided by TfL on the BL1 route (available at haveyoursay.tfl.gov.uk/BL1-superloop) we analysed the proposal, using Podaris to quantify catchment to the route for different demographic groups and comparing how catchment to a Superloop served station would change for residents if the BL1 service was introduced.
How can Podaris be used to support this kind of analysis?
In Podaris, you have the ability to import existing public transport services (using GTFS and TransXChange data), or create your own from scratch.
To model the new BL1 bus service, you can quickly add existing bus stops and join them together in patterns. Podaris’ automatic street-following functionality ensures that the platform seamlessly connects the stops using the underlying road network for you using historical traffic data to ensure realistic running times.
Calendars and trips were added to reflect the planned frequencies and operating hours for the route on different days and times of the week. Podaris uses this information to automatically calculate operational metrics such as minimum Peak Vehicle Requirements (PVRs) and revenue distances.
To analyse accessibility, we incorporated UK census data, which includes demographic details such as age, ethnicity, and disability status. This information was effortlessly added as a dataset layer via the integrated data library, but you can import custom GIS files through a simple drag-and-drop function.
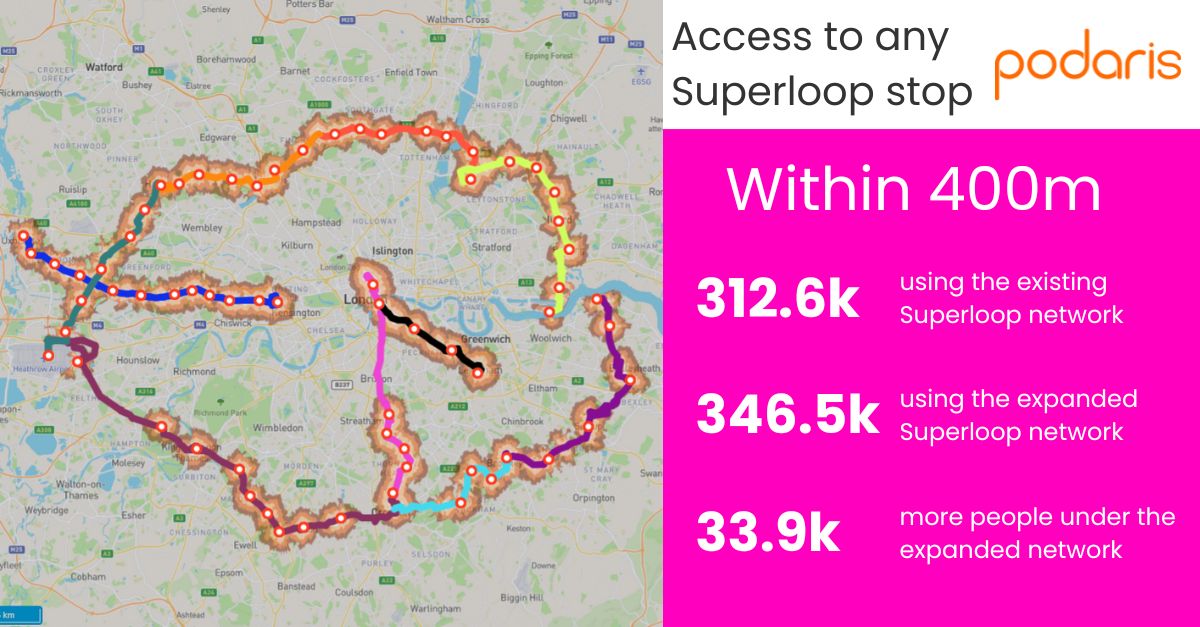
Using these datasets, Podaris enables the creation of travel-time and access-time isochrones. Our focus here was on pedestrian access within 400m of the route; Podaris’ street-based analysis method ensures the layout of buildings, street infrastructure, and elevation is taken into account when calculating this accessibility. In just a few steps, we can visualise the walkshed and quantify catchment for different demographic groups to any stops along the BL1 route.
Additionally, using publicly available data from the Bus Open Data Service, we were able to quickly import the existing Superloop network. With these routes added, we could generate catchment isochrones for the entire Superloop network, with and without our newly drawn BL1 service, and compare the number of people who can access a Superloop stop in each scenario.
Fancy trying to reproduce this analysis in Podaris yourself? Head over to our knowledgebase where you can find a step-by-step tutorial with all the datasets you need.