The Northumberland Line's remarkable ridership success demonstrates the need for measuring connectivity, not just speed
The transport planning profession is starting to notice a pattern. The Northumberland Line, which reopened in December after 60 years of closure, carried 250,000 passengers in its first three months - 400% above the annual forecast of 200,000. This extraordinary success isn't just good news for the North East; it's raising important questions about how we measure transport value.
Virtually all recent re-openings have exceeded the projected ridership, suggesting our current appraisal methodologies may be missing crucial elements. The pattern is clear across recent schemes: from schemes as large as the Elizabeth Line to reopenings like the Northumberland Line, new rail connectivity consistently outperforms expectations.
The Challenge of Measuring the Value of Connectivity
Traditional transport appraisal excels at quantifying time savings and capacity improvements on existing corridors. However, schemes like the Northumberland Line present a different challenge: they create entirely new connectivity rather than improving existing journeys. Our established methodologies, designed for incremental improvements, may struggle to capture the transformative value of restored or new links.
The £300 million Northumberland Line investment delivers 35-minute journeys between Newcastle and Ashington, but the real question is whether traditional appraisal methods can adequately capture the value of bringing previously isolated communities back onto the rail network. The dramatic ridership surprise suggests they may not.
Modelling the Northumberland Line in Podaris
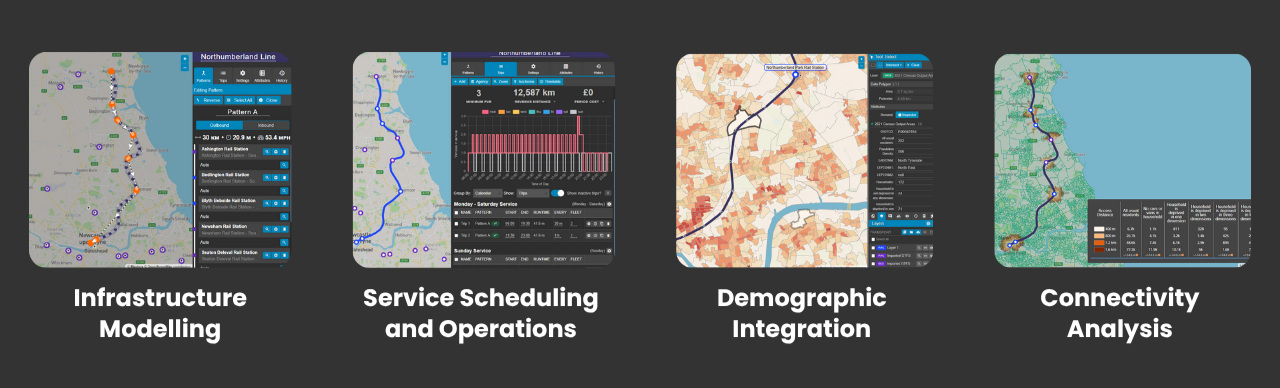
To better understand schemes like this, we used Podaris to conduct a comprehensive accessibility analysis of the Northumberland Line. Podaris is a collaborative web-based platform that enables transport planners to model, analyse, and visualise multimodal networks - from initial concept through to detailed ridership estimation.
Infrastructure Modelling
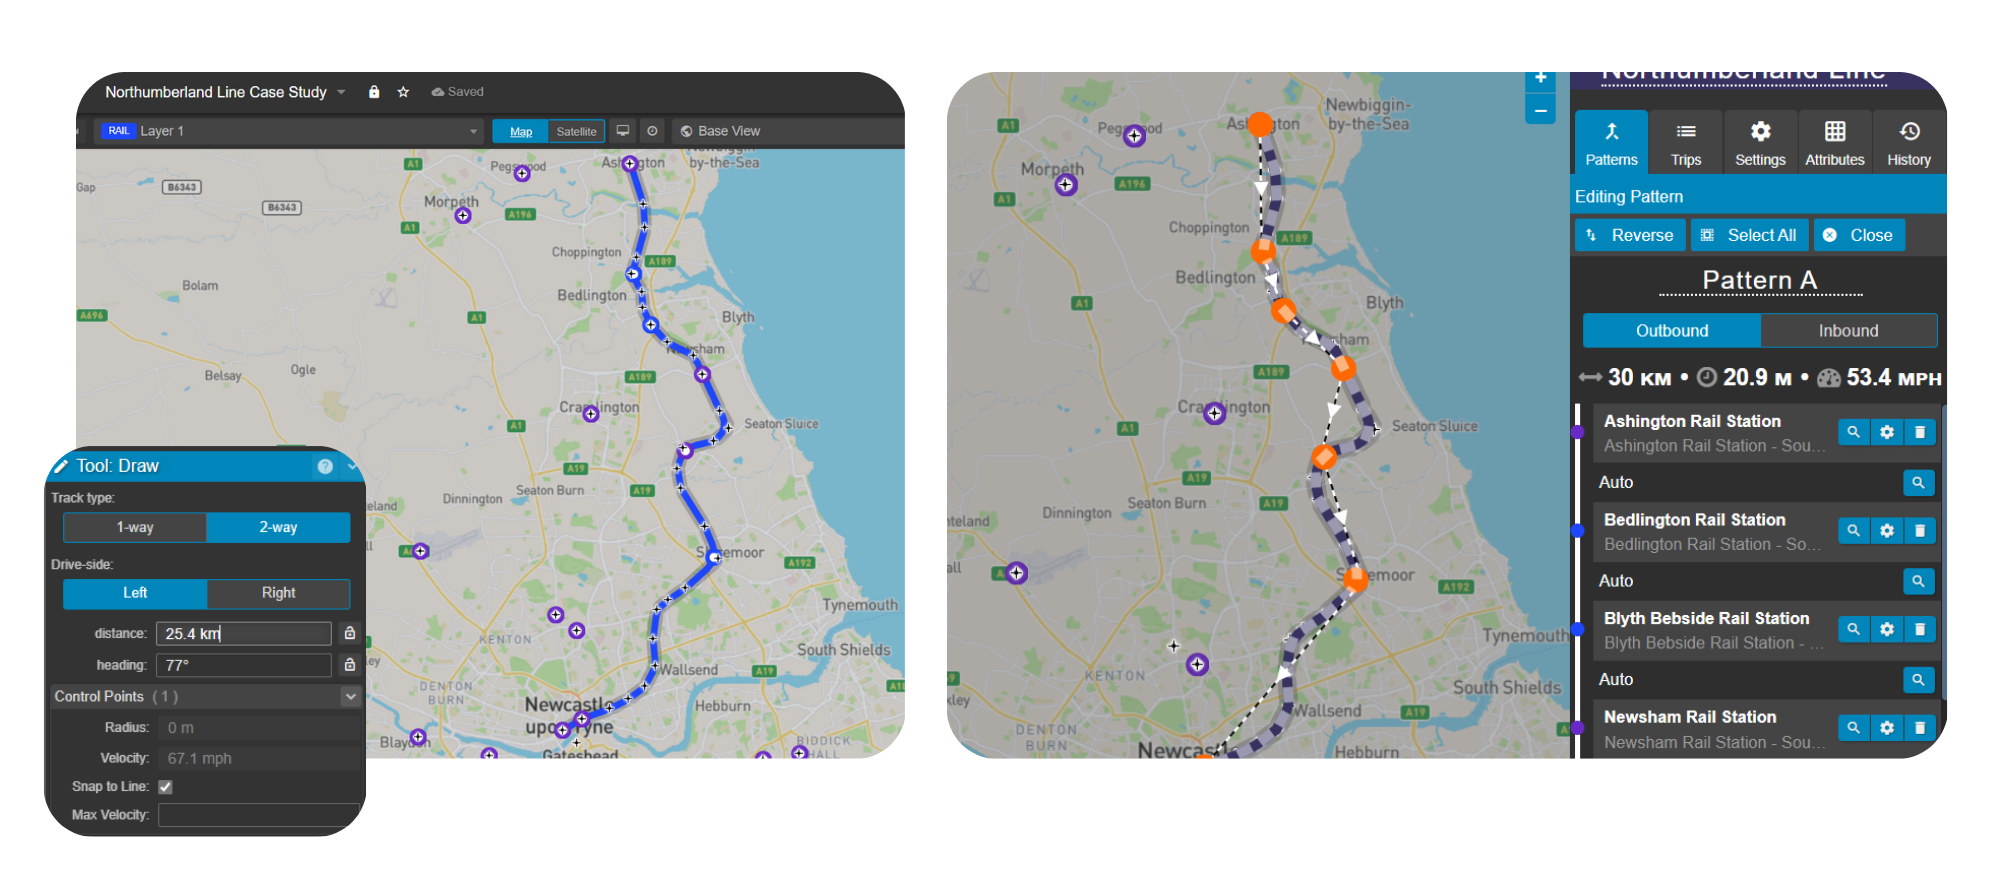
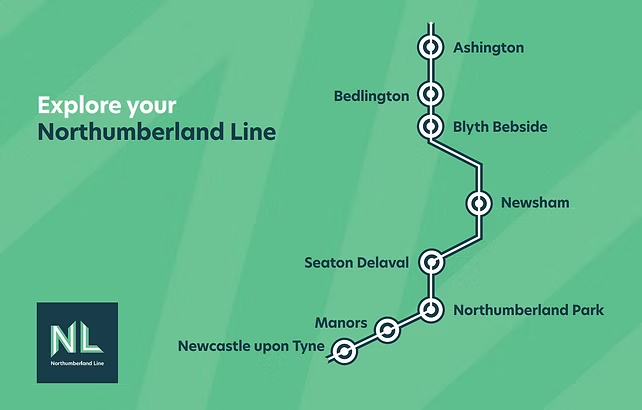
Using Podaris's constraint-based parametric modelling tools, we rapidly sketched the entire Northumberland Line infrastructure. The platform automatically handles velocity profiles and curvature constraints, ensuring our digital model accurately reflects the physical railway's operational characteristics. Our pattern editor enabled us to define service routes that automatically incorporate all six stations:
- Ashington
- Blyth Bebside
- Bedlington
- Newsham
- Seaton Delaval
- Northumberland Park
Service Scheduling and Operations
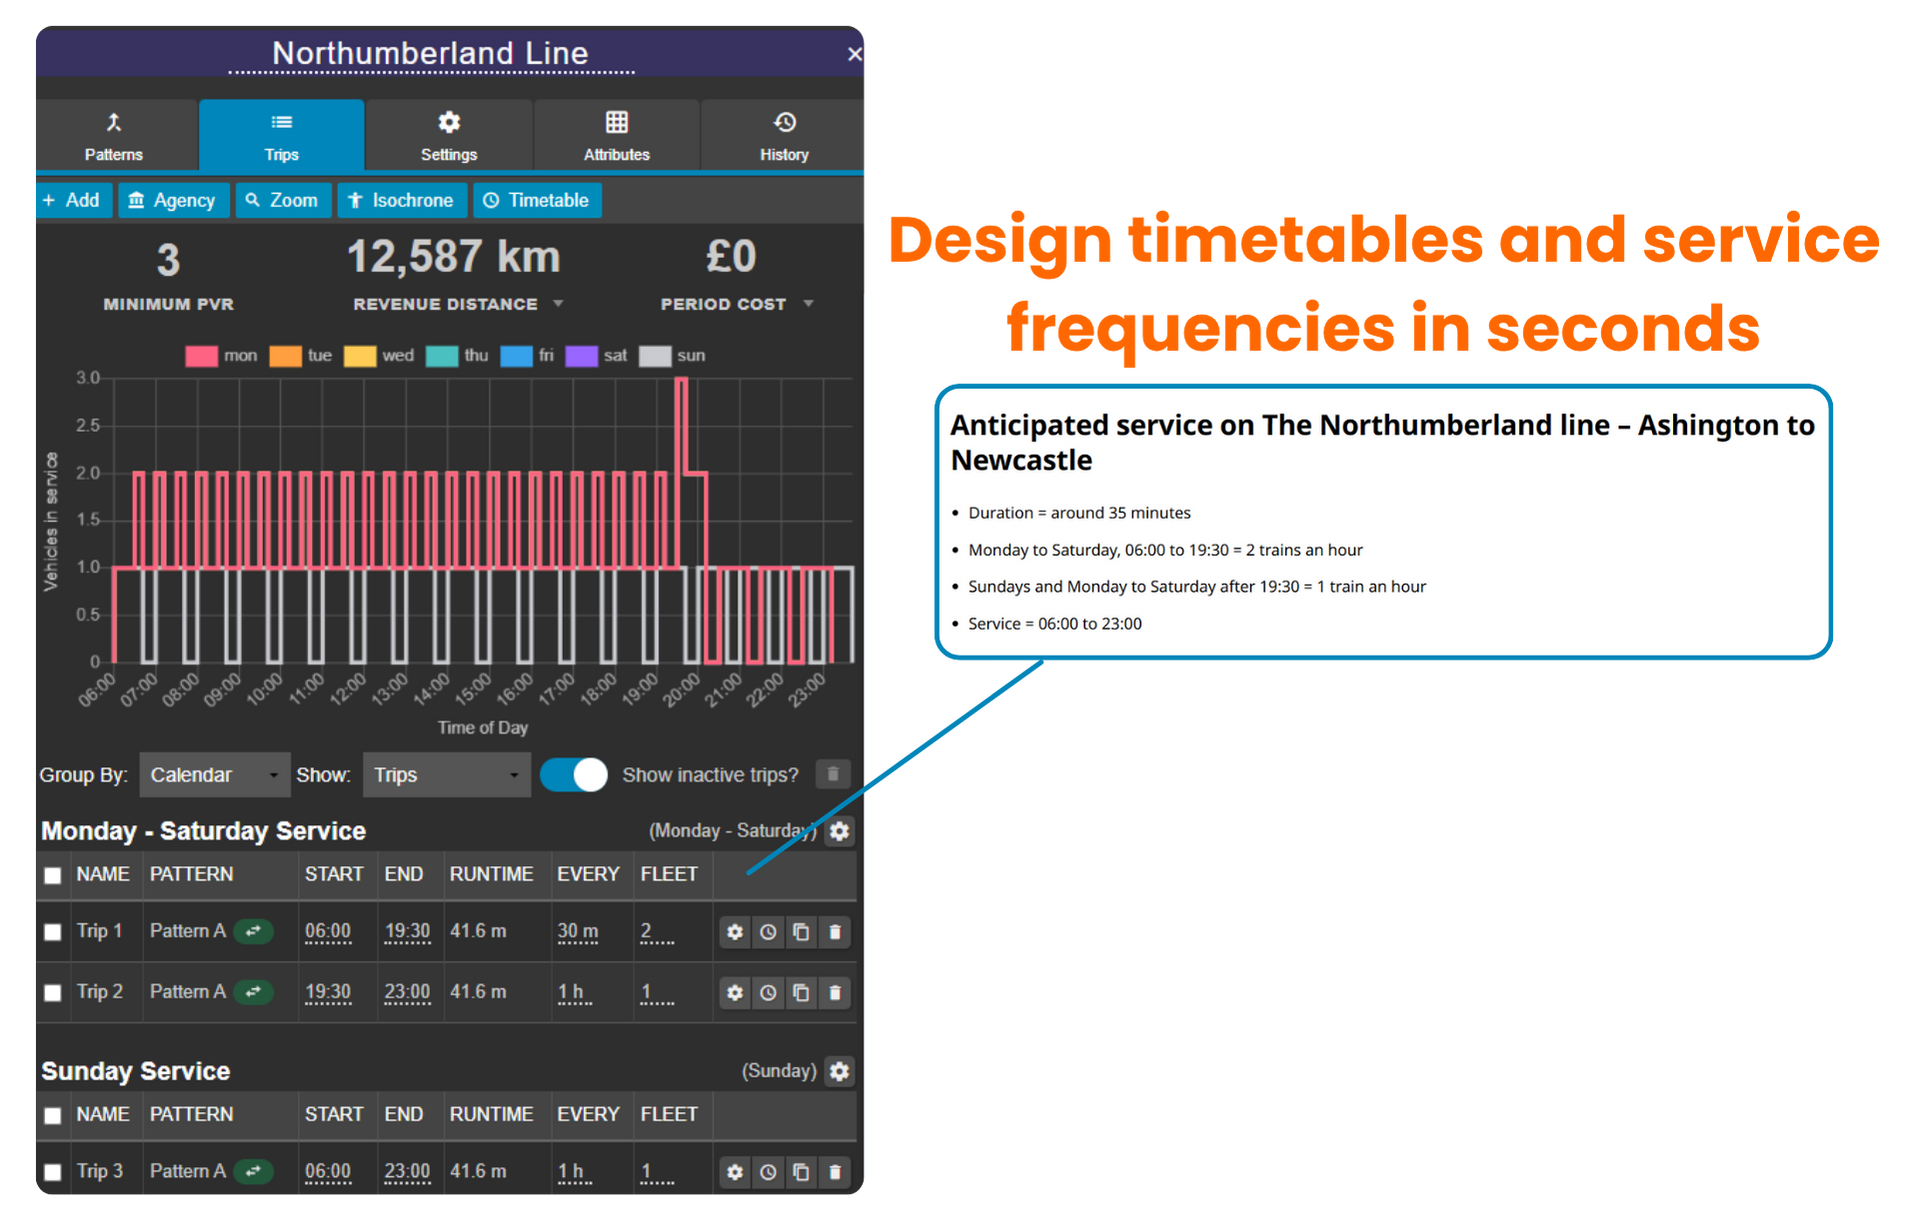
Podaris's trip scheduling and timetabling capabilities allowed us to model the anticipated schedule, exploring how different service levels affect fleet requirements, frequencies, and operating costs. The platform automatically calculates minimum Peak Vehicle Requirements (PVRs), runtimes, and service kilometres, providing real-time feedback as service patterns change—crucial for understanding operational feasibility alongside accessibility benefits.
Demographic Integration
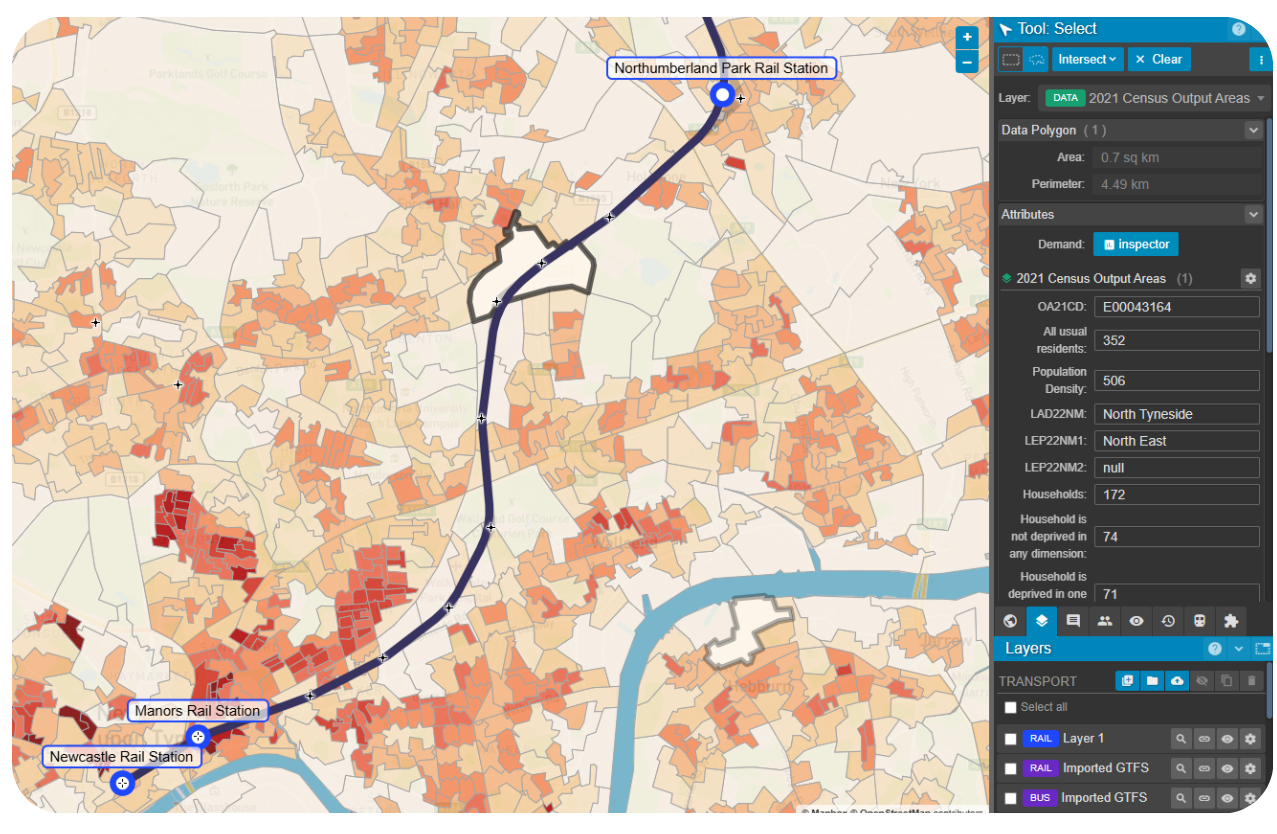
We imported Census data directly into the platform, applying GIS visualisation to reveal how the railway interacts with existing population patterns. By mapping datasets including population density, car ownership levels, and deprivation indices, we could immediately identify which communities would benefit most from the new connectivity.
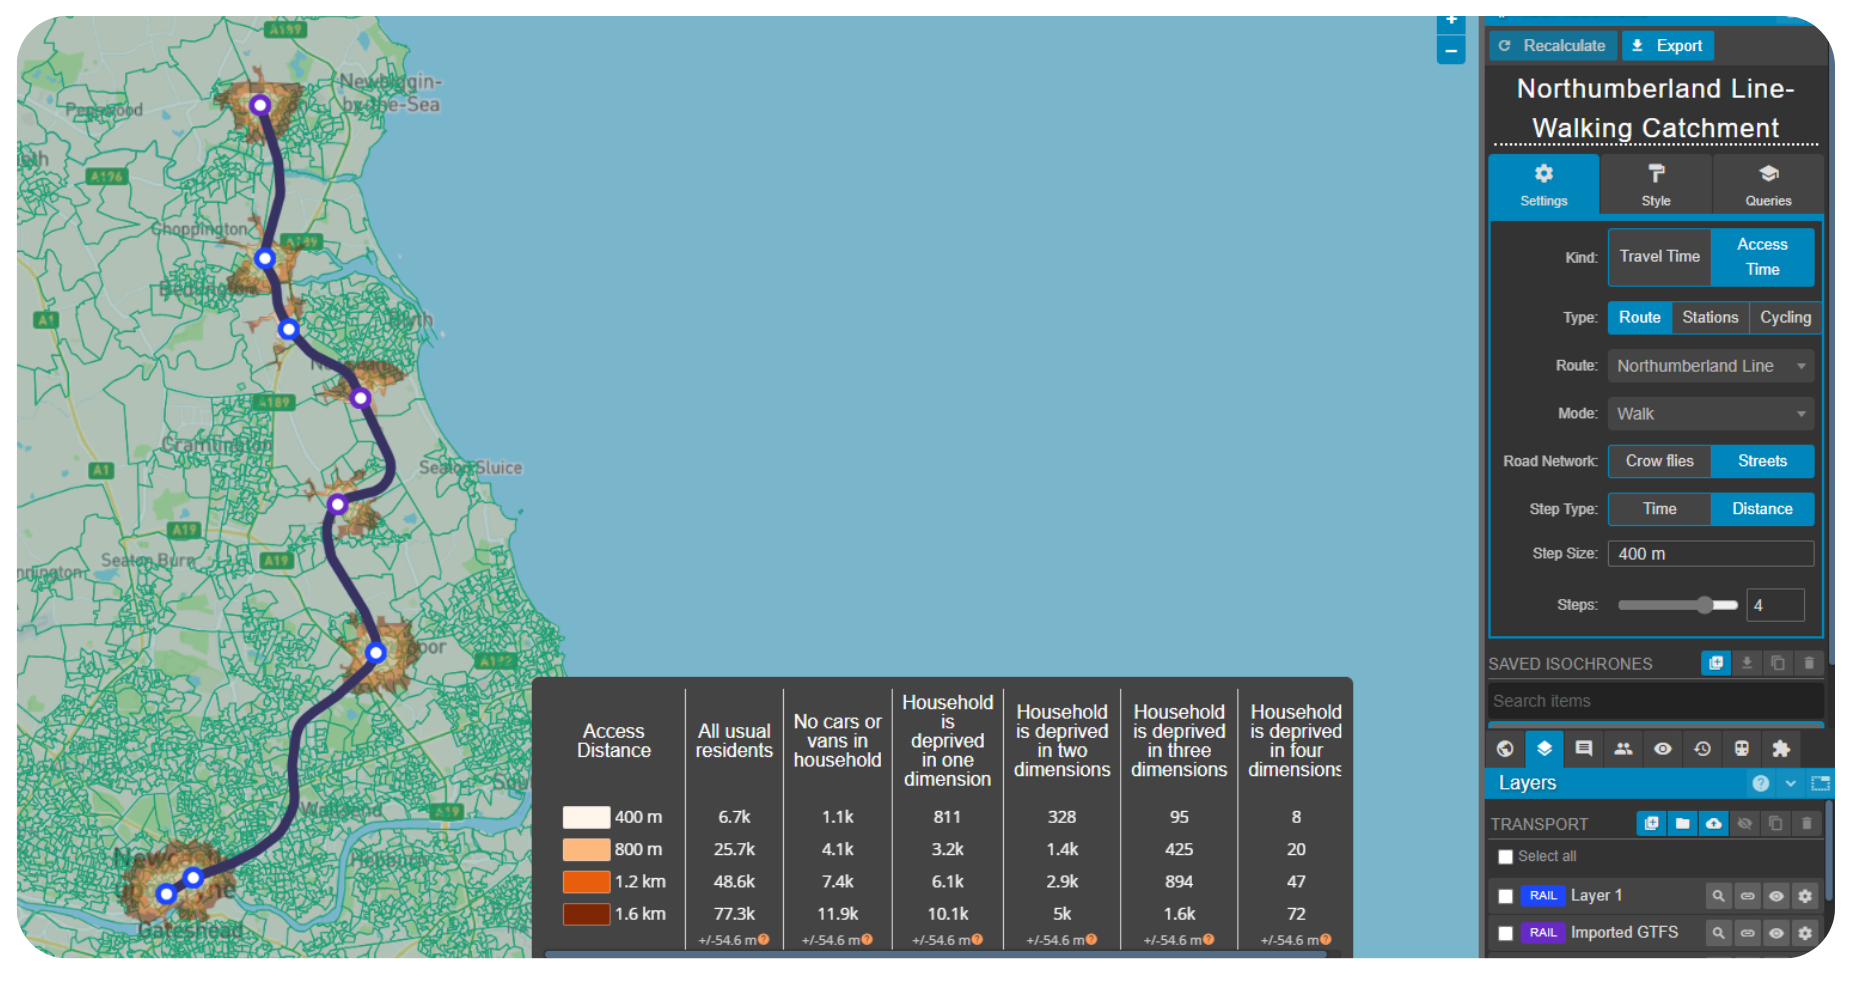
Accessibility Analysis at Scale
The real power of our analysis came through Podaris's isochrone functionality, which quantifies how transport improvements affect people's ability to reach destinations within specific time thresholds. Rather than simply measuring journey time reductions, this approach reveals who gains access to what, answering fundamental questions about transport equity and economic impact.
We generated isochrones for multiple time bands (15, 30, and 45 minutes) and combined these with demographic datasets to quantify accessibility improvements. The platform's query tools enabled us to ask specific questions: “How many residents without cars can now reach Newcastle city centre within 45 minutes?” or “Which communities gain access to major hospitals?”
The accessibility analysis uncovered significant value that traditional metrics might understate:
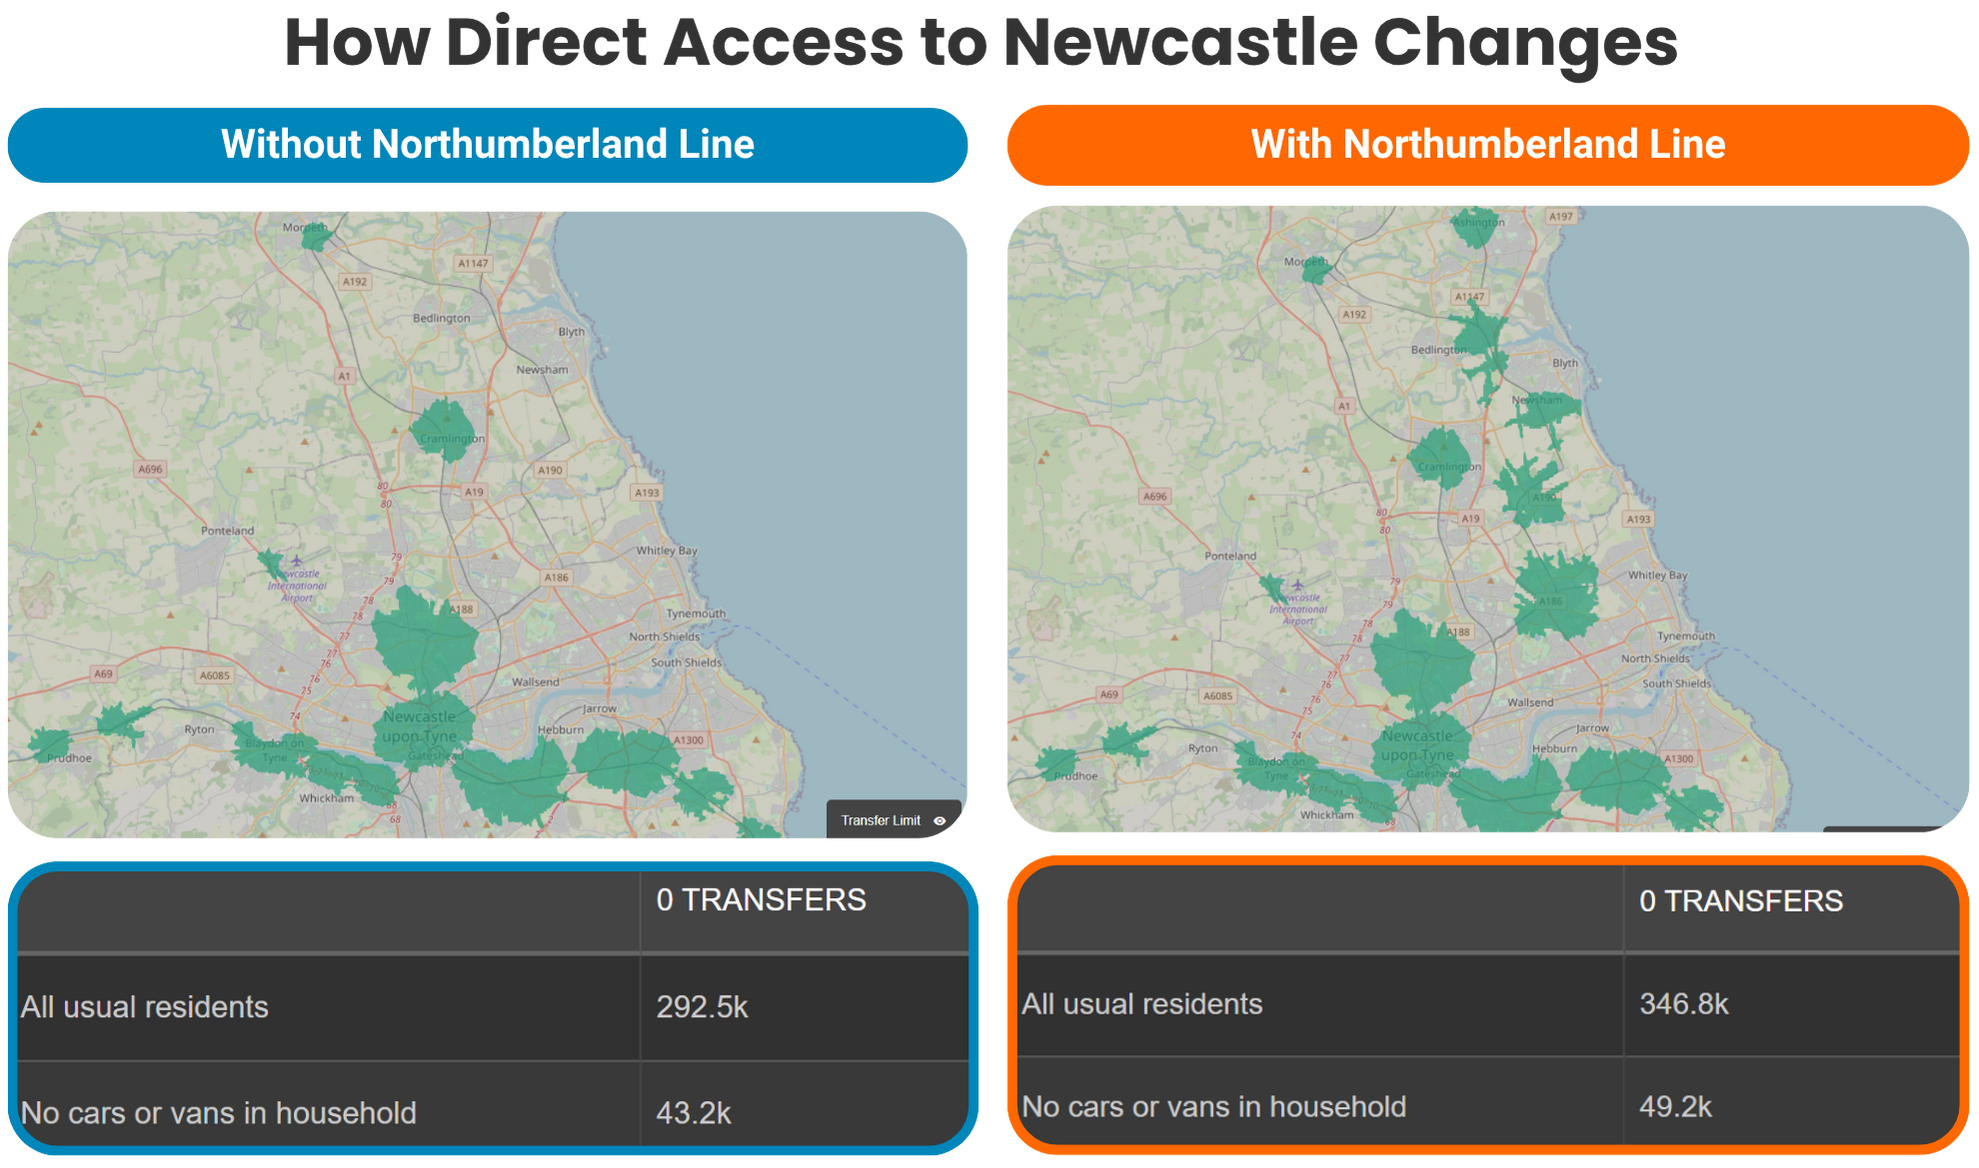
- 54,400 additional residents can now access Newcastle city centre within 45 minutes by rail
- 6,000 households without cars gain rail access to the city centre within 45 minutes, crucial for social equity
- Over 50,000 residents now have direct rail access, eliminating the need for complex interchange journeys
- Healthcare access is transformed, with major hospitals now reachable in under 30 minutes from previously isolated towns
The railway hasn't just improved existing journeys; it's enabled entirely new patterns of movement!
Looking Forward
The Northumberland Line's success doesn't suggest our current appraisal methods are wrong, rather that they may benefit from complementary approaches when evaluating connectivity-creating schemes. Tools like Podaris offer transport planners additional capabilities to:
- Model complex multimodal networks including bus, rail, cycling, and walking connections
- Generate connectivity analysis for any time threshold or demographic group
- Calculate operational metrics (fleet requirements, service frequencies, costs) alongside accessibility benefits
- Share interactive scenarios with stakeholders and team members for collaborative decision-making
- Export results in formats suitable for business case development and stakeholder reporting
As we consider future rail reopenings and new connectivity schemes, the Northumberland Line offers a reminder about measuring transport value. An underestimation of benefits is as problematic as overestimation; it means that vital schemes do not get funded. By combining traditional appraisal with accessibility analysis, transport planners can build more comprehensive cases for investment, capturing both the efficiency gains and the transformative connectivity benefits that schemes like this deliver.
The tools for this enhanced analysis are readily available and designed specifically for transport planning workflows. The question is how we integrate them into practice to better understand and communicate the full value of transport investment.
This analysis demonstrates Podaris's accessibility analysis capabilities, showing how demographic data can be combined with detailed network modelling to quantify connectivity improvements. The platform supports the full transport planning workflow from initial concept design through to detailed analysis, and is used by leading consultancies and transport bodies across the world. To explore how these methods might support your transport planning projects, visit podaris.com or contact our team for a demonstration.