There is a long-standing division of labour when providing public transport that has, for the most part, served everyone reasonably well. Planners concern themselves with networks, frequencies, catchments, and accessibility. Schedulers and operators take those plans and translate them into workable vehicle rosters, duties, and depot runs, using their own specialist tools.
Uncomfortable discoveries, such as, a route that would need to operator from depot which is on entirely the wrong side of town, or a new evening journey which exceeds the range of the EV bus have traditionally surfaced later in the process than anyone would like.
UK bus reform is making this arrangement harder to sustain. As Local Transport Authorities take a greater role in network design through Enhanced Partnerships and franchising, operational constraints are becoming planning constraints. Depot locations, fleet sizes, and electrification strategies now need to be considered alongside frequency and accessibility — not handed over to someone else to worry about afterwards.
Podaris has always been able to tell you how many vehicles your proposed network requires and how much they may cost to operator. Today's update makes it considerably easier to understand why.
What the blocking engine has always been doing
Podaris is a planning tool, and that is not changing. It has no ambitions to replace dedicated scheduling software, which handles driver duties, labour rules, and operational rosters in a level of detail that is simply outside the scope of strategic planning.
What Podaris has always included, however, is a sophisticated event-driven blocking simulator. Every time you define a service – specifying routes, trip patterns, frequencies, and layovers —- Podaris constructs vehicle blocks in the background: the sequences of trips a single vehicle would undertake across an operating day. Those blocks are what underpin the Peak Vehicle Requirement (PVR), mileage, and cost figures that Podaris surfaces.
Until now, you could see those headline outputs. You could not see the blocks generating them.
The Block Viewer
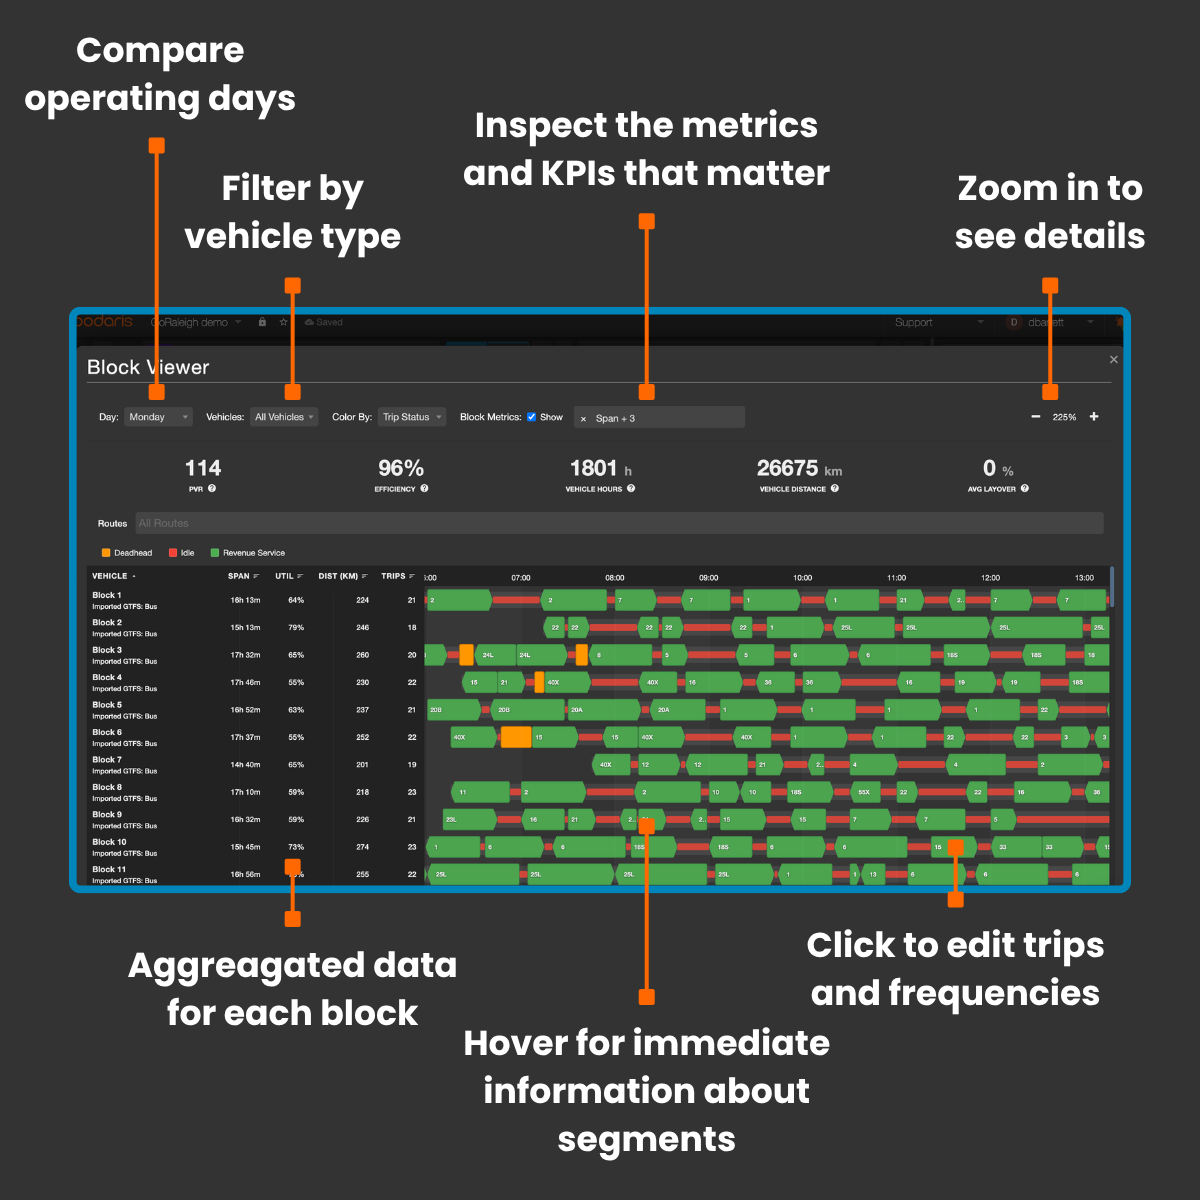
The Block Viewer is a new Gantt chart interface that exposes the blocks generated by Podaris’ blocking engine, giving planners a clear picture of vehicle movements across the operating day. It is accessible at network level, showing blocks across all active transport services, or drilled down to a specific route.
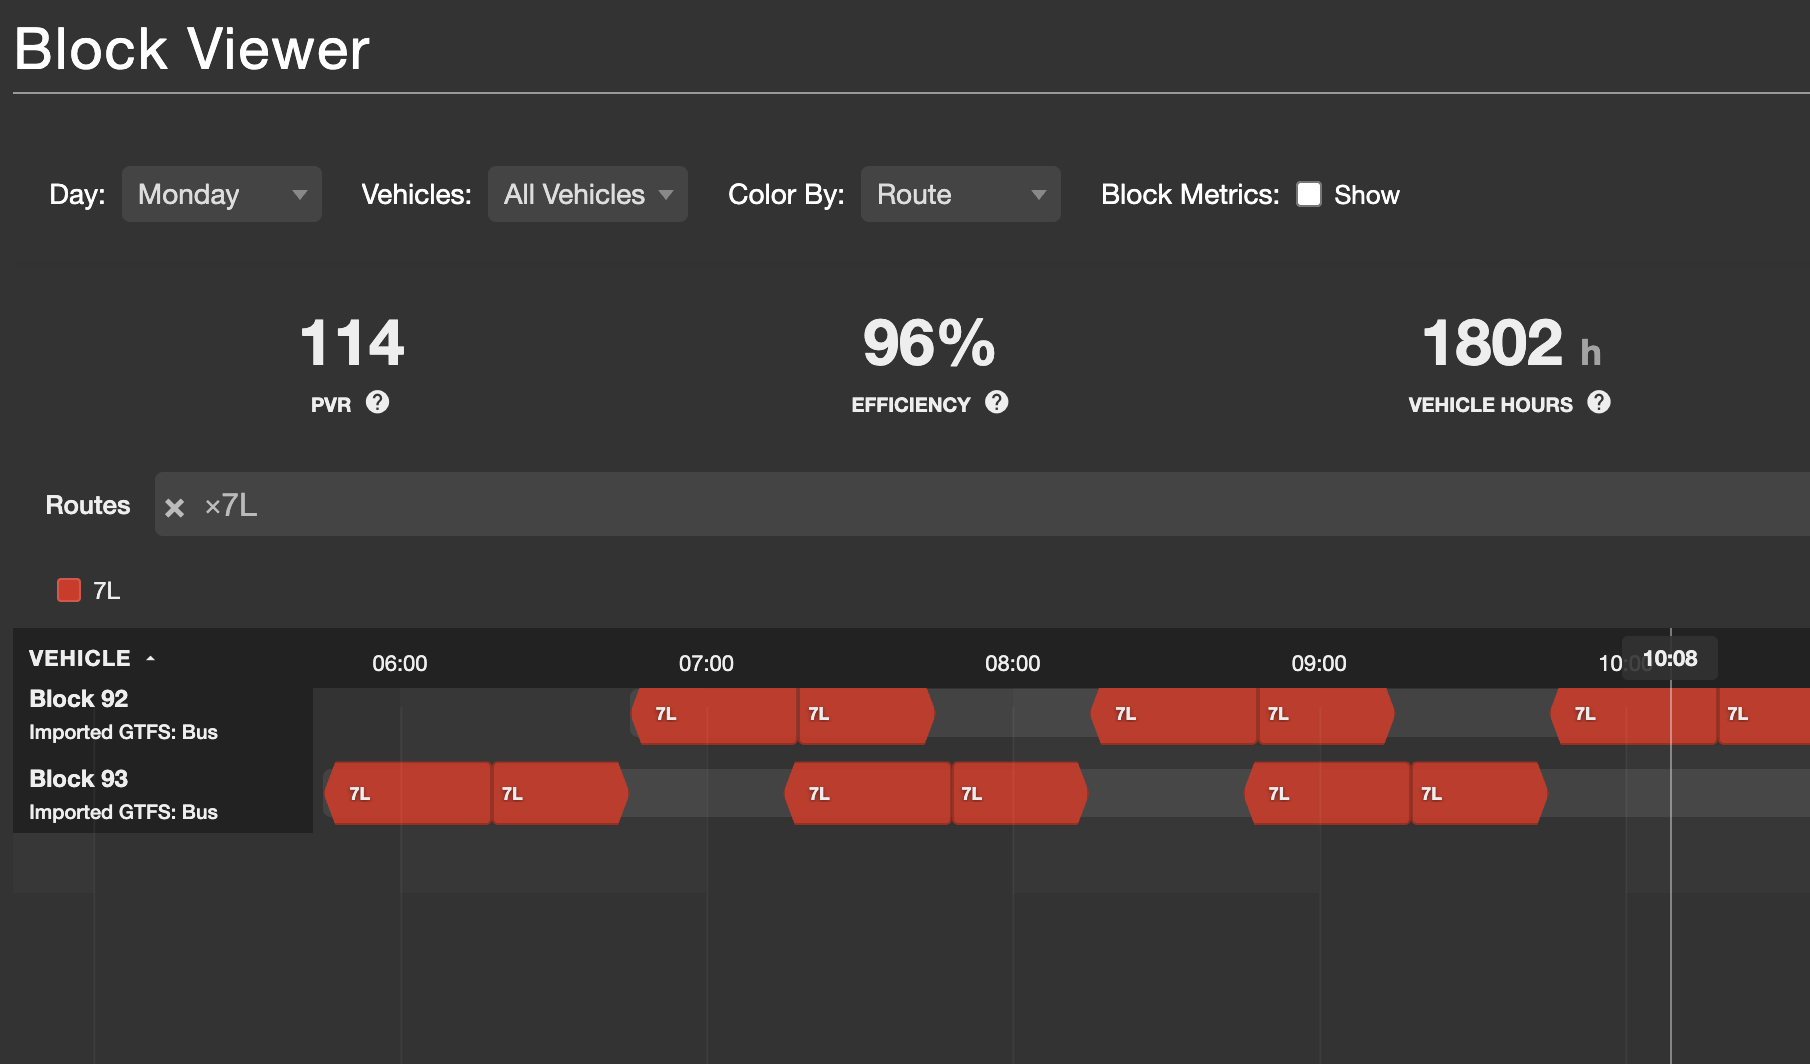
At either level, the viewer lets you browse by operating day to understand how fleet requirements vary across the week. You can see how individual vehicles move between trips, where layovers fall, and crucially, when the peak vehicle requirement actually occurs and what is driving it.
Clicking on any block takes you directly to the trip generating it, where you can make edits using the AI-enabled trip time editor and immediately see the effect on the blocks and PVR.
Putting it to use
For authorities moving towards bus franchising models, where depot locations, fleet types, and resource requirements constrain network planning in new ways, you can now show exactly where those occur, which services are driving it, and how proposed changes to frequency or timetabling would alter it.
The blocks generated by Podaris are ephemeral. They are constructed dynamically from your schedule data, and any change to your network can alter them significantly. This is by design: the engine responds to your planning decisions in real time. These are planning-grade insights rather than operational outputs, and should be understood in that context.
We have ideas for where this feature goes next, including fleet range and charging constraint support for EV planning, and compatibility with TODS. As always, we'd like to hear what you'd find most useful.
The Block Viewer is available to all Podaris users today. Try it out or schedule a demo to see it in action.