
Last month we discussed the requirement for Local Authorities and operators within the England (and outside of London) to update their Bus Service Improvement Plans (BSIPs). We took a look at the latest Government guidance, released early 2024, and outlined what is required and what has changed since 2021. A new requirement mentioned in the document, applicable to all Local Transport Authorities (LTAs) and coming this spring, is the Bus Connectivity Assessment (BCA).
The annual assessments, to be developed in collaboration with bus operators, are designed to help ‘identify the best bus network available [in terms of meeting connectivity objectives] at various levels of funding.’ There will be some overlap in terms of the evidence gathered for these assessments with BSIPs and LTA's Local Transport Plans.
Details are still scant, although some of the issues expected to be included in the assessments include:
- Connectivity
- Patronage
- Types of Service
- Innovation
- Funding
We have seen considerable use of the Podaris platform for the development of Bus Service Improvement Plans over the last few years, including by Local Authorities who have successfully used Podaris to secure millions in funding for service enhancements.
Many of the tools that have been instrumental in providing supporting evidence for these plans continue to be a perfect fit for BCAs.
Enhancing Connectivity
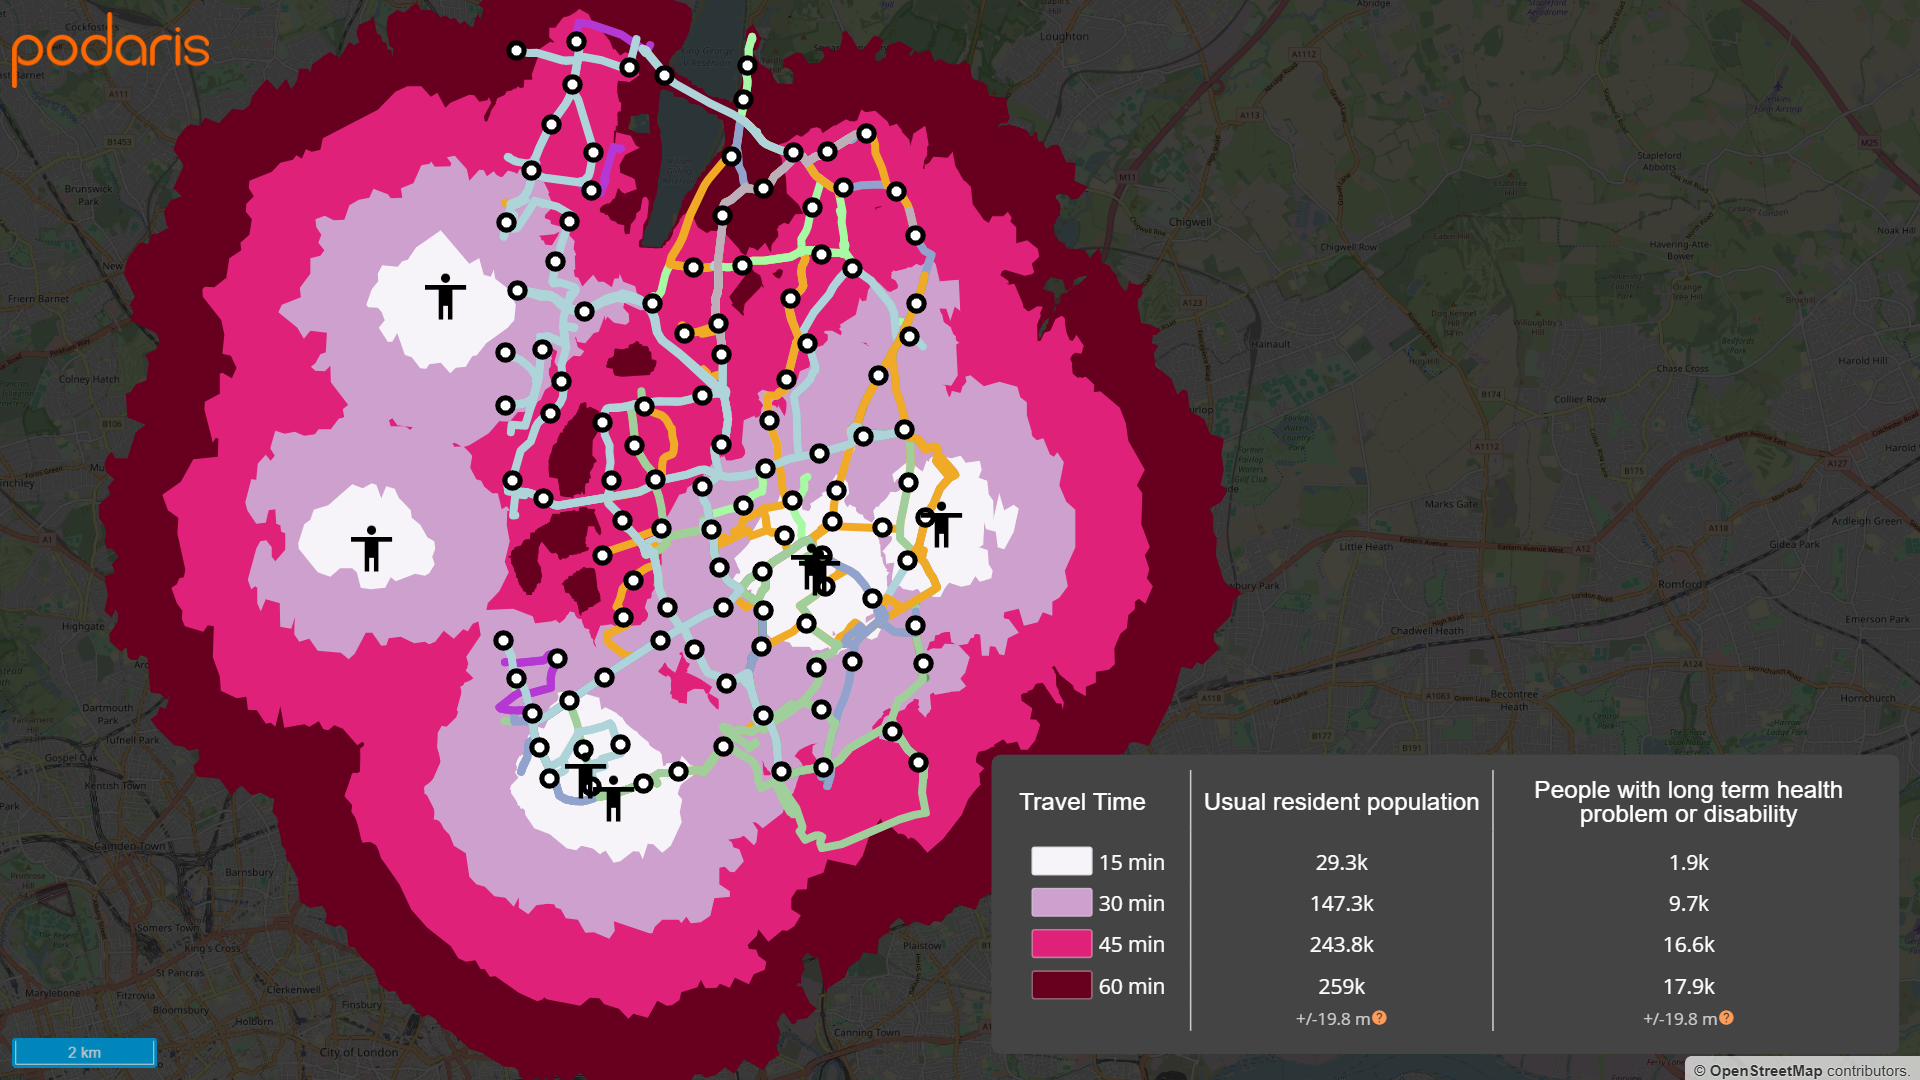
Podaris’ simple yet powerful tools empower you to assess the connections of bus networks between any number of points of interest, including those listed in the Government's guidance. These tools help you to answer questions such as: “how many residents can access hospitals using our existing bus network within an hour?”
The same tools can of course be applied to understanding connectivity to employment, leisure, services and residential locations. You can quantify and visualise the accessibility afforded by your bus network to determine travel time to these destinations and the number of people who can access them within, for example, 15, 30, 45 and 60 minutes, using the network.
You can of course filter these results according to date and time, in order to ask the same question in the context of weekday peak, or Saturday morning, for example.
As a multimodal planning application, Podaris allows you to understand journeys as they are actually made and explore connectivity between bus, train, tram, and a number of other modes of transport, setting a maximum number of transfers and a maximum access distance, if necessary. It can generate end-to-end journey plans that provide a complete picture of the travel options between two points, using your existing or proposed networks.
With the Multi-Criteria Index Analysis tool, you can create zones to travel to or from across your network within a given time period. Within these zones various features (healthcare, supermarkets, libraries, etc…) are each assigned a value, and a per zone score is calculated. This makes the tool ideal for helping you to identify disparities in access and guide efforts to improve accessibility, particularly for disadvantaged or underserved populations.
Growing Patronage
Another issue that operators and LTAs are expected to report on as part of their BCAs are the actions they expect to take to grow patronage. Here, Podaris provides several tools to explore the potential impact of different scenarios on ridership.
Quick estimates of potential patrons or ridership can be calculated through catchment analysis using our street-based isochrone engine. A more accurate picture of demand and mode choice can be derived by using the Podaris demand modelling engine to predict the changes between scenarios in mode choice and ridership down to the stop level.
Types of Service
The third issue facing LTAs and operators is that they report the types of service available on their network. This includes percentage of tendered costs, numbers of zero-emission buses and DRT services.
For Podaris customers Translink, the public transport provider for Northern Ireland, tools like the service summary report functionality has been invaluable in providing statistical data at a service-level during their network reviews. This includes:
- Frequencies by time of day
- Weekly revenue distance
- Number of weekly trips
- Active days of the week
- Percentage of low-floor trips
Podaris’ DRT capabilities also allow you to create on-demand services and generate outputs such as peak vehicle requirements, service area, average occupancy and costs.
Growing Revenue Innovatively
The fourth issue is one of innovation - developing innovative approaches to growing revenue. Here Podaris allows you to quantify the impact of a range of comparative scenarios and determine whether they have the potential to grow revenue. Our fare strategy modelling tools, for example, offer a flexible way to estimate per network or operator revenue resulting from a wide number of potential fare structures.
In early 2023, Nottinghamshire County Council conducted a bus network review for Vision West Notts College (VWNC), using the Podaris platform. The results informed changes to travel passes and the network, migrating approximately 15k students from the private bus network to the local bus network.
As further guidance on BCAs is shared, we will bring you more news and detail on how digital tools can help enhance and accelerate the production of these documents. To discover how Podaris can help you plan smarter, faster and more collaboratively, schedule a demo with us today!