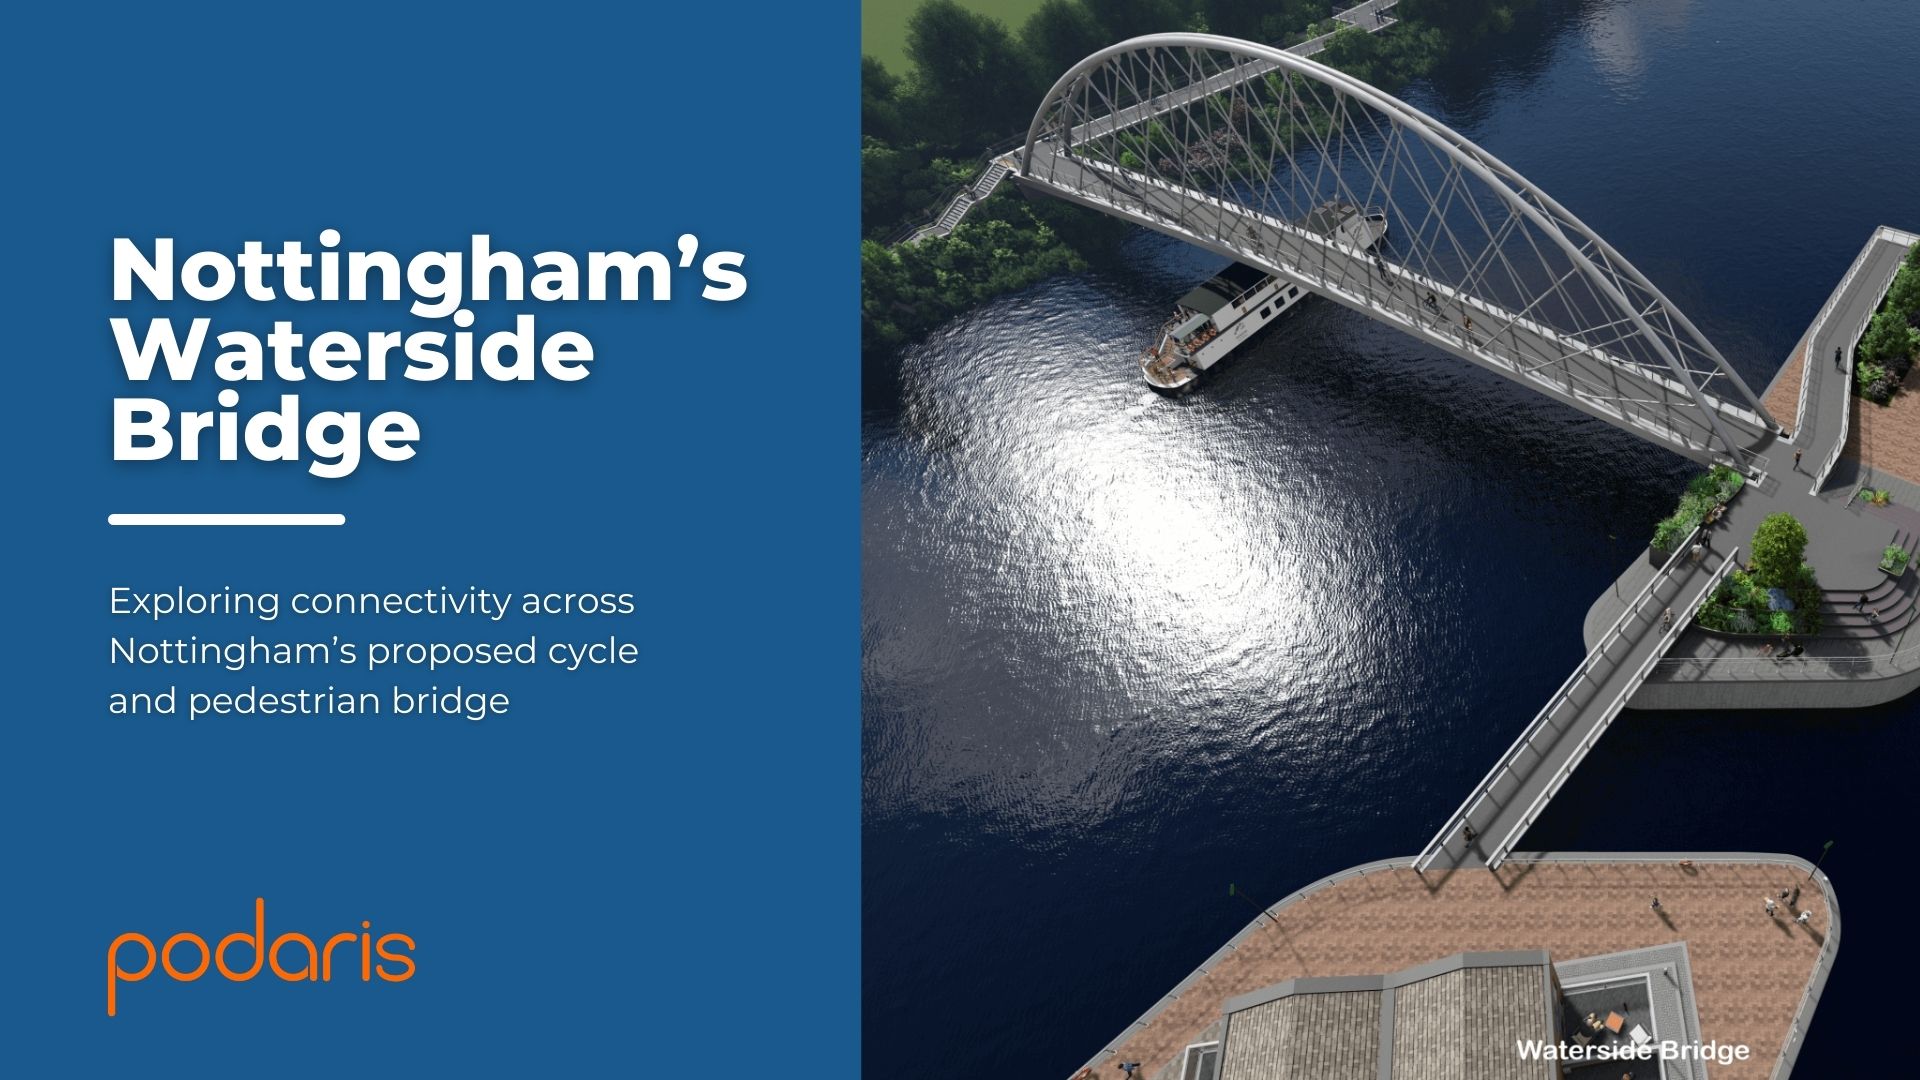
By late 2025, Nottingham's new ‘Waterside Bridge’, the first in 60 years to span the Trent, will be open to pedestrians and cyclists. The city council submitted their planning applications this month for the bridge that will link the expanding Waterside regeneration area, Colwick Park on the north bank, and the Lady Bay/West Bridgford area to the south.
This comes after the council successfully secured funding from the Government's Transforming Cities Fund in 2020 and subsequently brought the project to public consultation.
Through the bridge, connections will be made between communities, and easier access to green spaces and sports grounds forged. Councillor Angela Kandola, Nottingham City Council’s Portfolio Holder for Transport, hopes that it will encourage “more sustainable, lower-carbon journeys … an important part of our plan to achieve Carbon Neutral Nottingham 2028.”
The choice of the Trent Basin for a location will open up quieter routes for travel for those travelling on bike and foot, as well as helping to meet the demand for travel over the Trent by people living much further afield, as a route for commuting and finding leisure activities.
We decided to use Podaris to explore the potential impact of the bridge in terms of reachability within 10 minutes by bike, and the number of residents afforded access within that time frame.
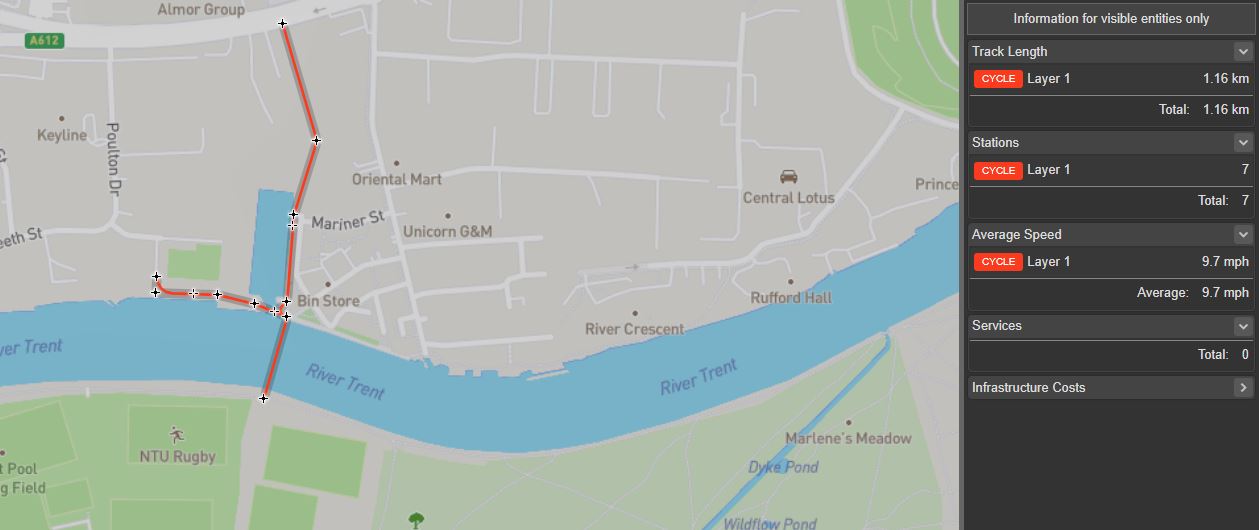
To do this, we first imported census data for the region, and created two “views” within Podaris. These views allow us to distinguish between existing and proposed scenarios. In our case, the latter is created using Podaris’ fixed infrastructure tools, high-level engineering capabilities that allow you to create a cycle path that will inform new travel time analysis.
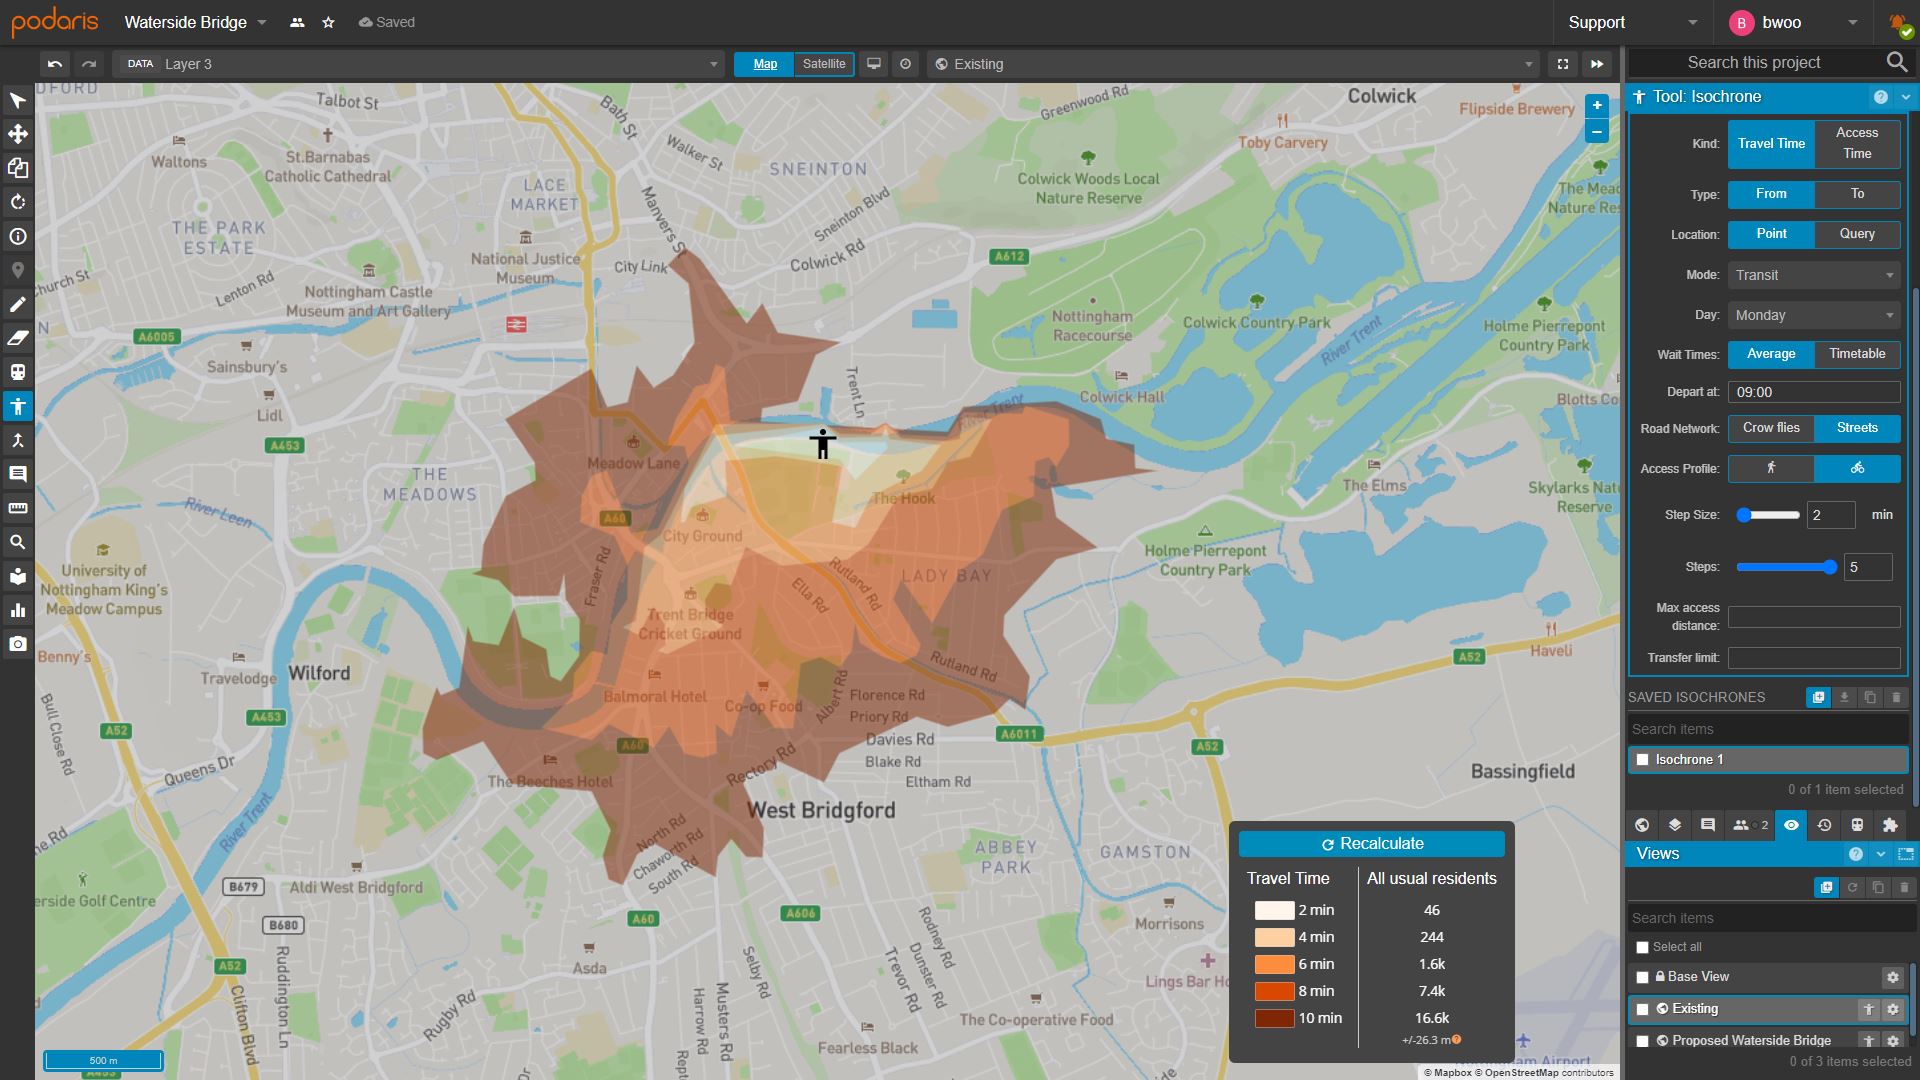
We perform our travel time analysis with Podaris’ isochrone tool, which allows us to visualise travel time in a given number of steps. Here we set 2 minute increments up to a maximum of 10 minutes. Combined with our census dataset of residents, we can visualise and quantify reachability and residents served, before the installation of the bridge:
and after:
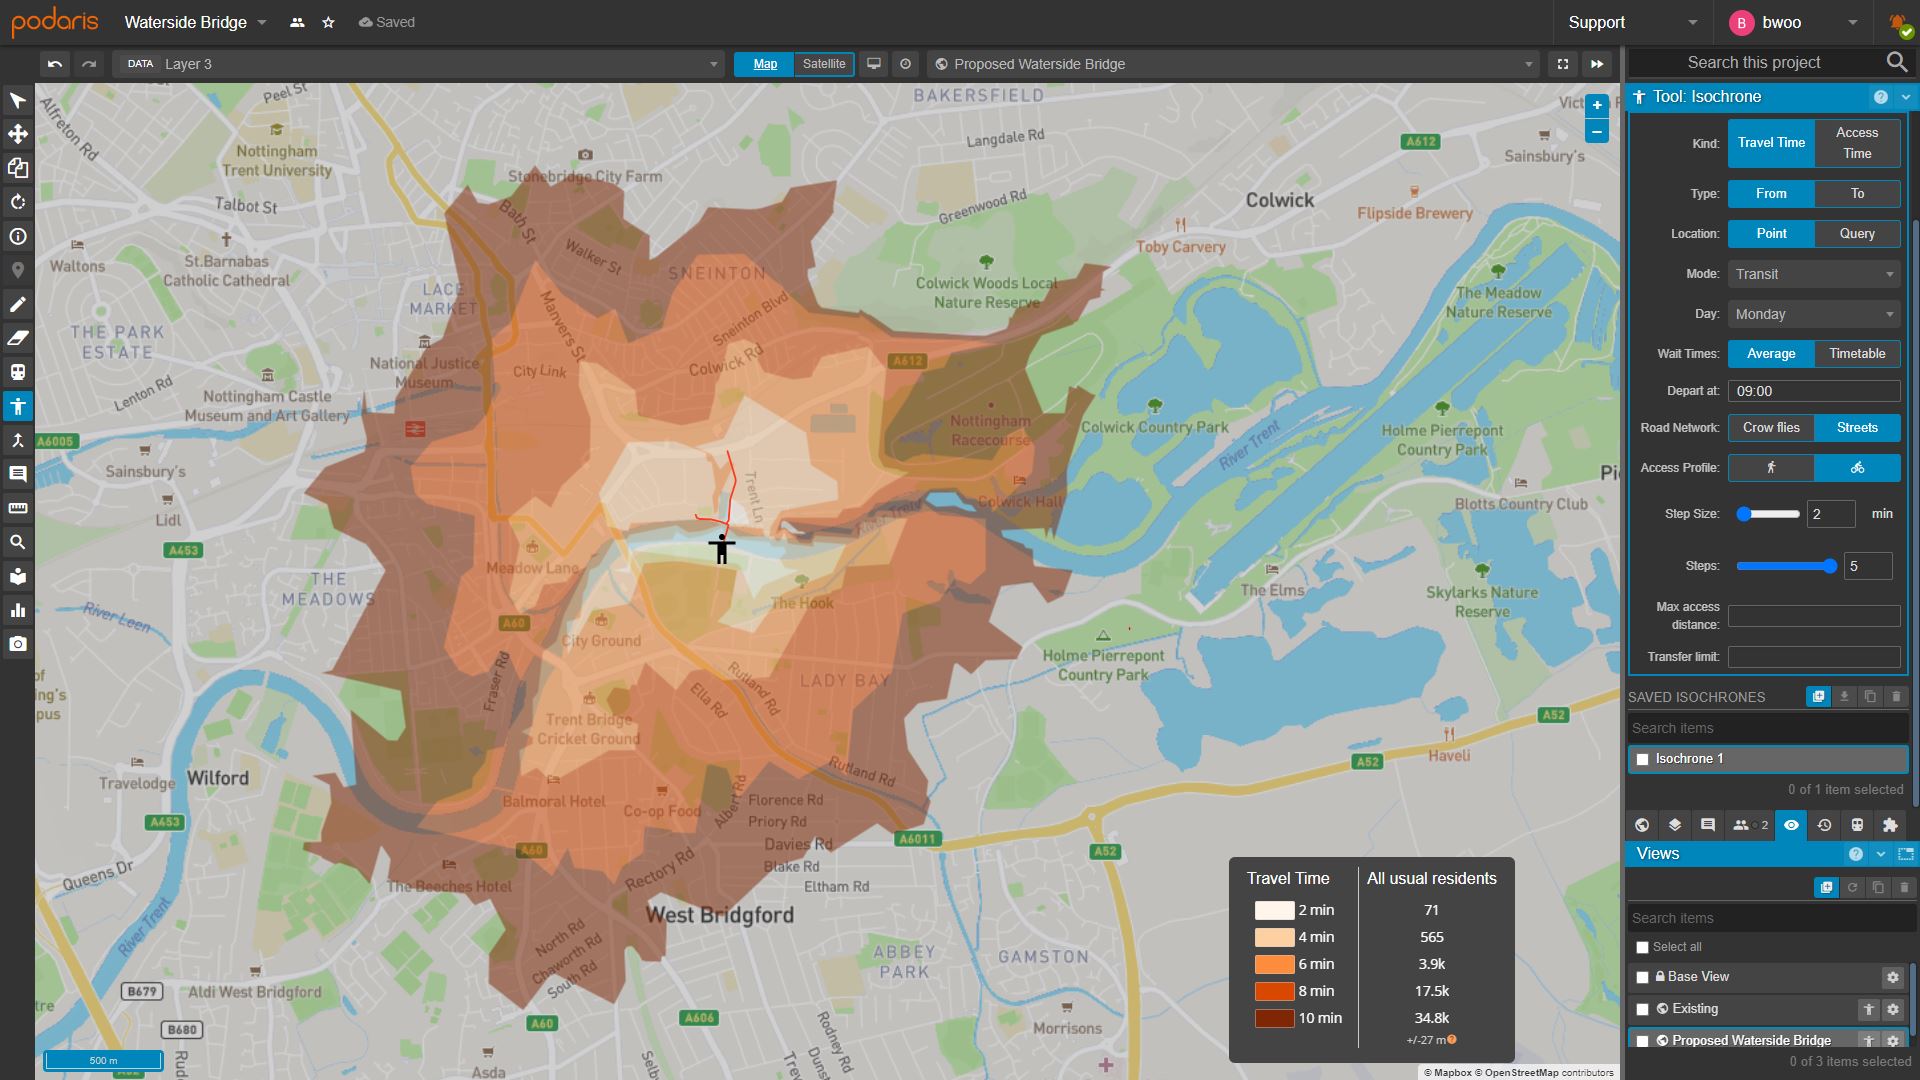
As we can see, the total number of residents served in 10 minutes before the inclusion of the bridge is 16.6k. The addition of the bridge shows a significant impact, more than doubling that number to 34.6k.
This sort of isochrone analysis is just one of the many powerful, easy-to-use tools for exploring connectivity on the Podaris platform. Podaris is a fully multimodal, cloud-based application for rapid transport planning and analysis. To discover how it can enhance your planning projects schedule a demo with us today.