As Podaris has evolved, one of the most consistent pieces of feedback from our users has been how indispensable the platform has become for editing GTFS feeds. While GTFS was originally conceived as a means of preparing transit information for passengers, it has become widely used in planning, and as a result of its ubiquity (and the optional nature of some of the specification), planners and analysts are typically exposed to a wide range of feeds – from the good, to the bad, and the downright ugly.
We've recognised that not all feeds are created equal, and as a result, Podaris makes importing, transforming and exporting GTFS trivial, even when working with low-quality feeds with invalid or missing table data.
At the import stage, Podaris gives you a variety of options depending on whether your focus is journey planning and travel-time/catchment analysis, or analysis of attributes such as fleet size, and the modification of routes.
For higher-level analysis, a smaller subset of dates imported from a GTFS feed is often sufficient – consequently, Podaris allows you to import only the busiest week, or specify your own range of dates for analysis. You can, of course, import all date information, if required.
Similarly, Podaris gives you control over whether to use the lat/long points specified in your GTFS feed's shapes.txt to draw vehicle paths, or use the internal street-following capabilities within the platform to automatically generate patterns for bus routes.
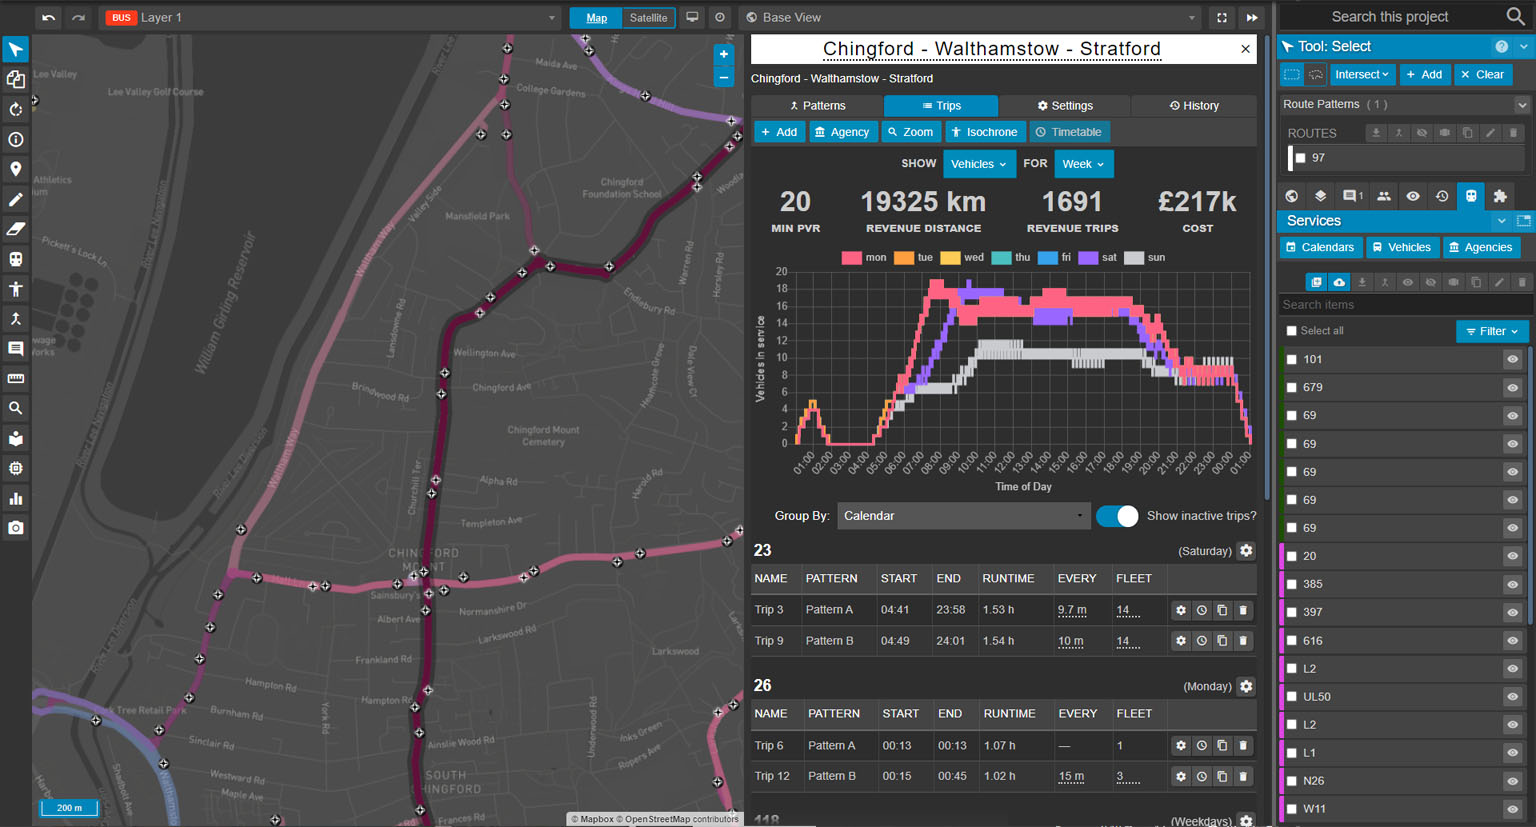
Generate insights instantly
As well as providing immediate and interactive views of your imported route patterns on a map, Podaris gives you at-a-glance stats derived from your feed, including:
- Peak vehicle requirements
- Revenue distance and time
- Number of routes, agencies and trips
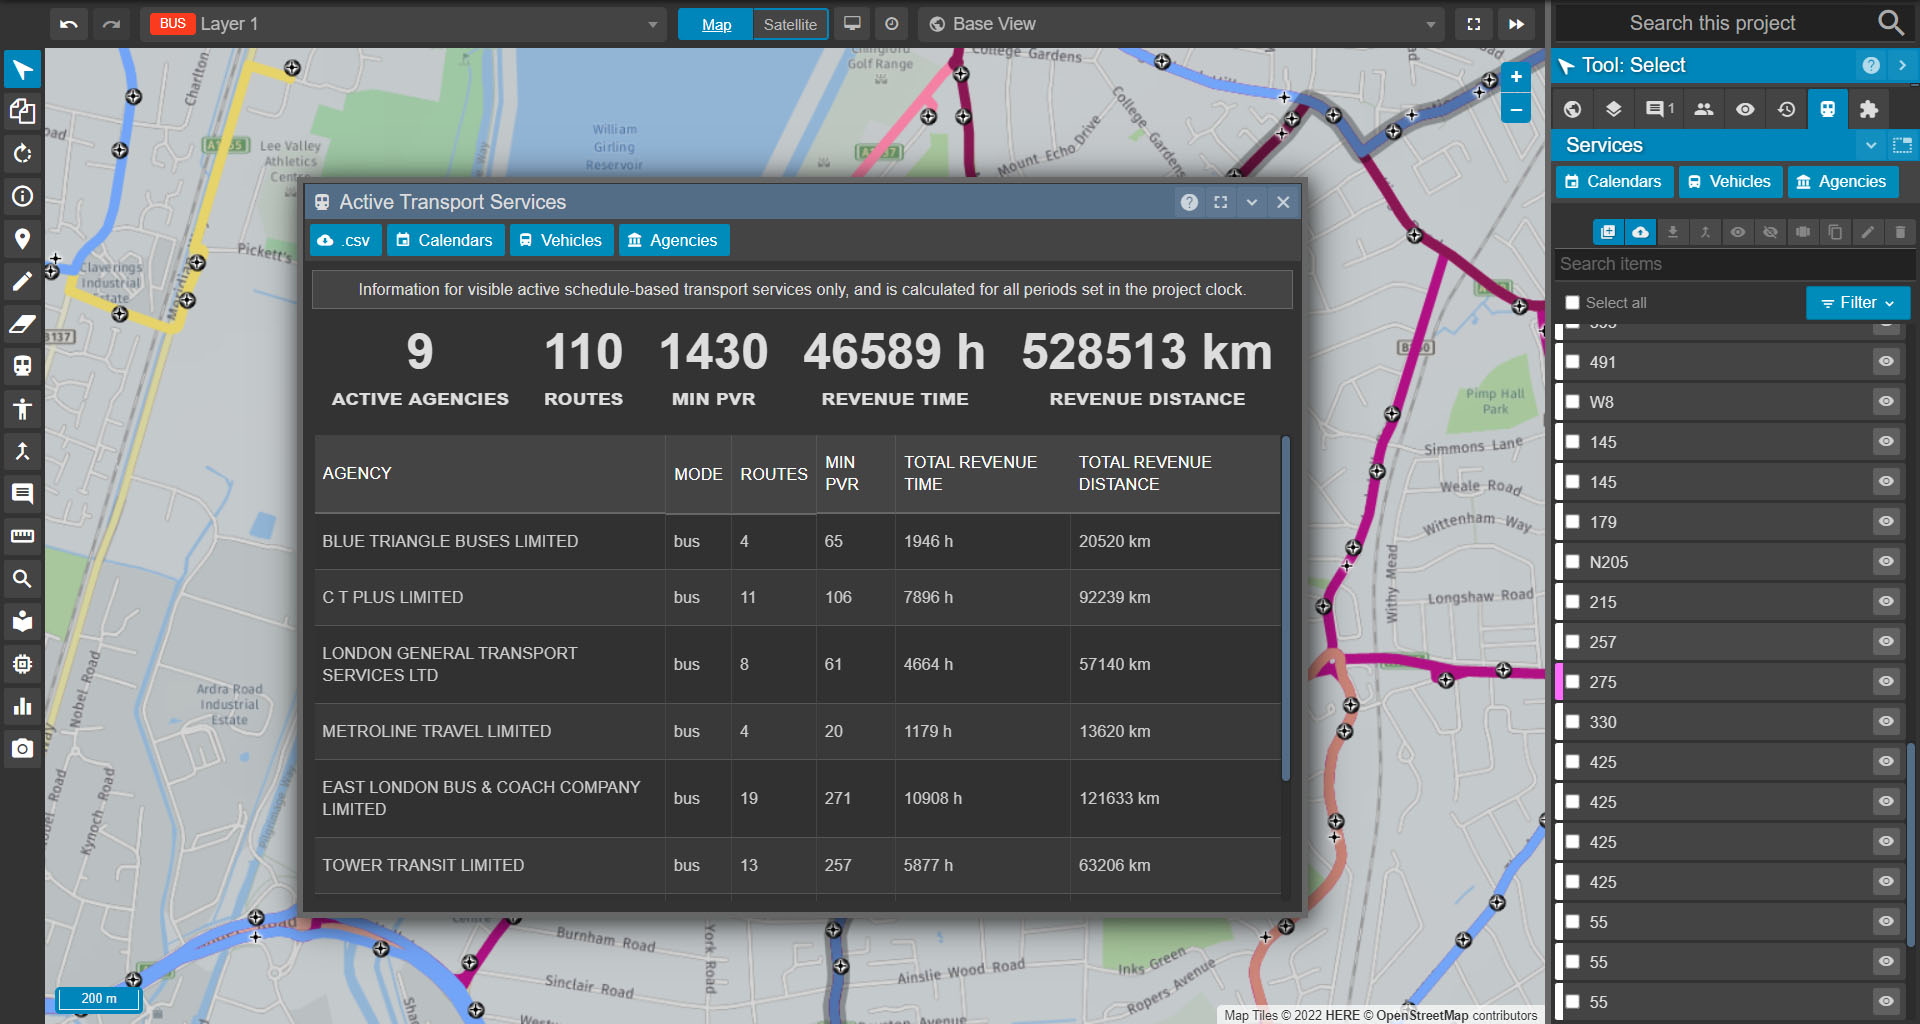
These can be produced for individual services, or groups of services. The ability to select groups of services for analysis is extensive, and beyond the scope of this post but by using our query editor you can easily isolate and sum outputs based on routes that operate:
- X number of average or peak vehicles per hour
- With a specific transport agency/operator
- With a certain number of trips
Importing your feeds is a simple drag-and-drop affair, and once imported, services can be explored in a wide variety of ways with zero set-up, such as:
- Identifying the number of vehicles in service on a given date/day or for the week
- Understanding capacity across these time periods
- Exploring the number of revenue trips and revenue distance in a similarly granular way.
Taking the complexity out of GTFS
GTFS feeds come in all shapes and sizes, and in variable quality. Even those feeds that adhere stringently to the specification are typically less than human-friendly when worked with as raw data.
Podaris allows you to set human-readable IDs across your services, meaning you can produce your own unique identifiers for new or existing services. These can be applied to stops, routes, trips, calendars and agencies – and can be exported as a new GTFS file if needed.
Of course, Podaris’ GTFS editing capabilities don't exist in isolation - imported feeds can form the basis of projects that allow for extensive route analysis, allowing you to see the effects of modifications to your services instantly, be that in terms of travel-time across the network (or throughout connected networks comprised of different modes), or catchment (along routes or from stops).
TransXChange data can also be imported and sit alongside GTFS feeds in the same project, or be transformed into GTFS on export.
To see the full potential of Podaris in working with transit feeds and beyond, get in touch with us today to schedule a demo and discover how you can accelerate your transport projects.