Tools for planning and analysing multimodal transport networks have typically either been of the low-tech pen/paper/spreadsheet variety, or have involved complex GIS applications with a steep learning curve and a fundamental lack of collaborative capabilities.
For less technical stakeholders and collaborators, the arcane nature of such GIS tools often precludes any meaningful involvement in the planning process.
As a combined platform for planning, analysis and engagement, Podaris brings together a wide variety of tools for building and appraising transport schemes in one easy-to-use place. Crucially, it reduces powerful operations to a few clicks, enabling you to generate insights in minutes instead of days.
Here are a few of the ways Podaris can help acclerate your transport planning:
1. Rapidly plan detours and diversions
Planning detours means more than simply redrawing lines on a map. It means the informed appraisal of potential alterations and their impact. While the experience, intuition, and local knowledge of seasoned transport planners is a strong foundation for this sort of decision-making, rapid modelling can also provide valuable insights into the effects of proposed changes.
Creating a detour for a route or pattern can be done within a few clicks. For bus routes, Podaris will automatically update the path, journey time, and recalculate the timetables.
The dynamic nature of route planning in Podaris means that any such effects are recalculated and reflected instantly within your projects - from costings and fleet size requirements to demographic effects, explorable through highly tunable geospatial dataset queries.
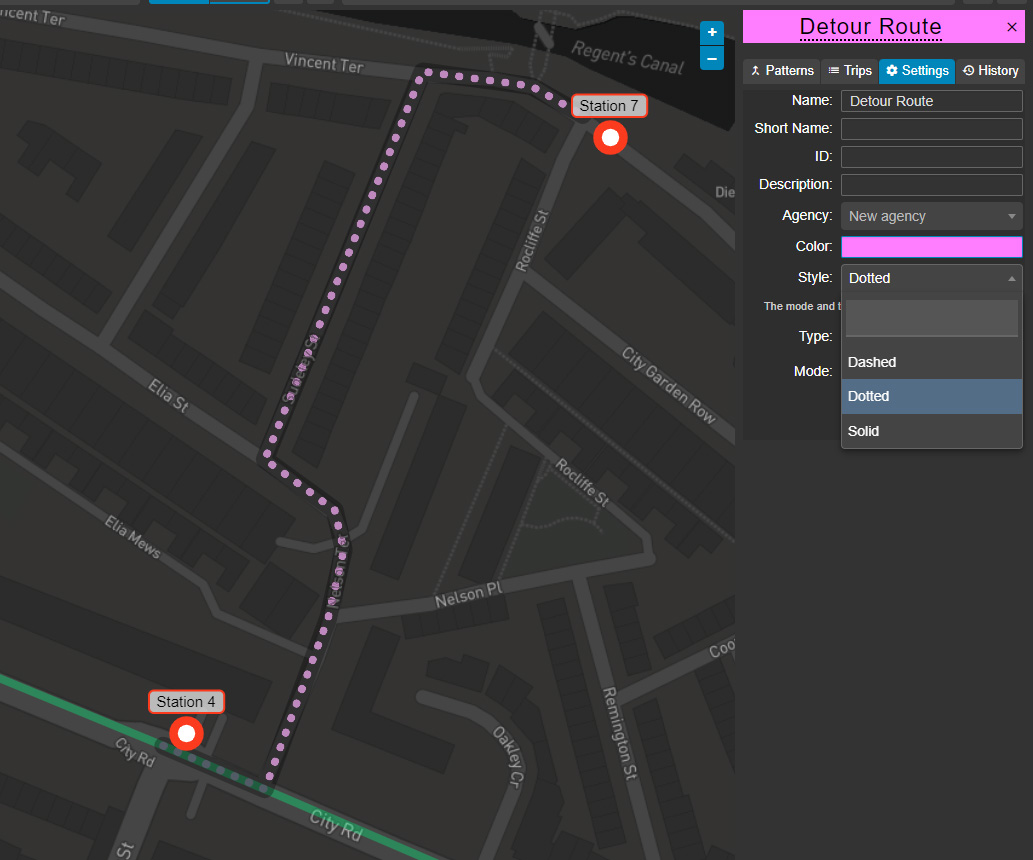
Podaris presents several tools for implementing and styling detours. Dashed or dotted route styling (below) can serve as a way of distinguishing route alterations from the original route. This styling is carried over to Podaris:Engage, helping you to showcase these alterations to stakeholders in its simplified presentational mode.
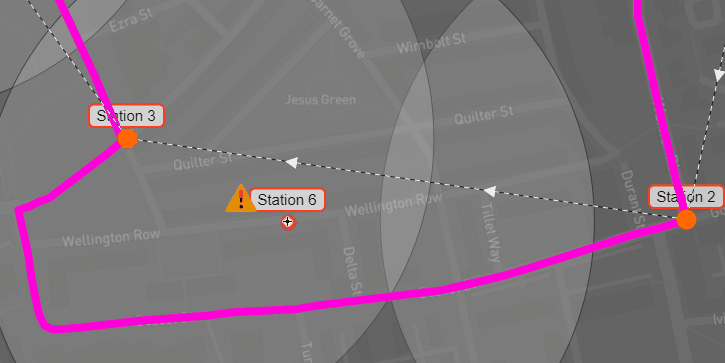
Waypoints are a feature that allow you to create a detour on an existing route, between two stops. Unlike stations, these do not cause vehicles to slow down on approach. Detours created in this way inform calculations of things such as runtime, peak vehicle requirements and accessibility across your network.
Within the Analyst tool, features for analysing and visualising the effects of these detours exist to help you better understand factors such as bus frequency on a given route. This can help you determine factors such as the total vehicles per hour which use a particular road segment.
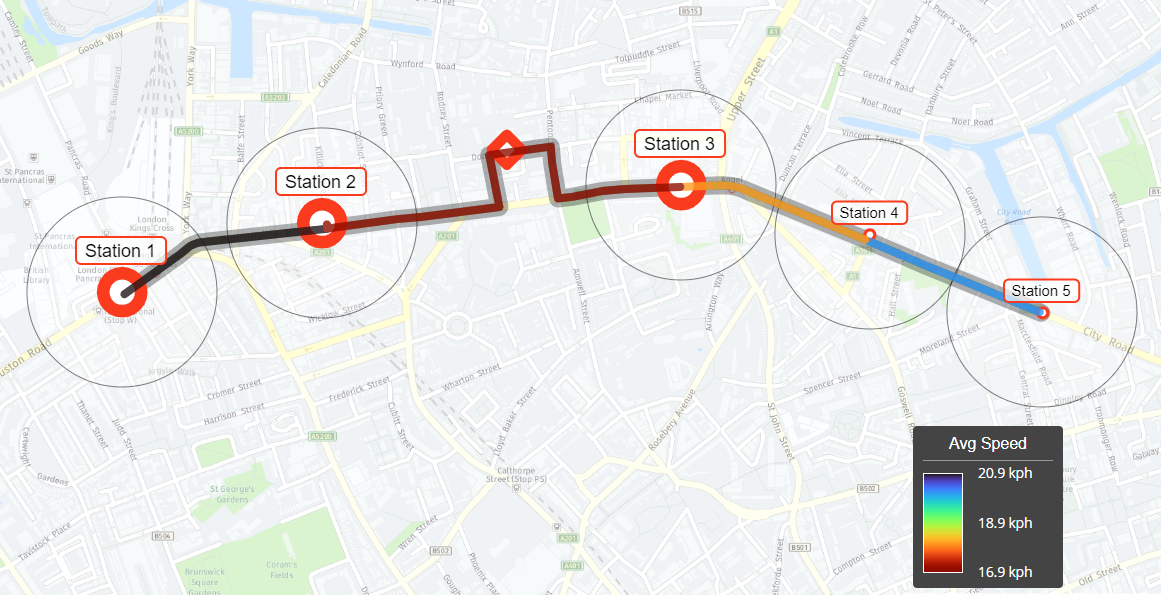
To help you understand the potential effects on congestion along your routes, the newly added stopwatch tool in our pattern editor generates average speed profiles for each station-to-station segment along a pattern. This takes into account historical traffic speeds but can be overridden on a per segment basis if required.
2. Connect and extend
We've built Podaris not to compete, but to interoperate with your existing tools, and to allow the outputs and integrations that it creates to be used as inputs in a wide variety of third-party applications, from Google Sheets to industry-standard GIS apps. With the Podaris API, its extensibility is effectively limitless. We've already seen third-party development such as an extension for assessing the risk of COVID-19 exposure across different routing options in London.
Podaris was built to solve the problem of data siloing during transport planning, and by extension expedite project delivery by promoting collaboration and sychronising organisational assets. While Podaris produces an extensive variety of outputs internally, we recognise the requirement for those outputs to be made available for use outside of the platform.
Therefore, in almost all aspects of planning and analysis within Podaris, those outputs are available to export for use in third-party applications. Some of these export options include:
- Matrices of station-to-station travel times along fixed infrastructure
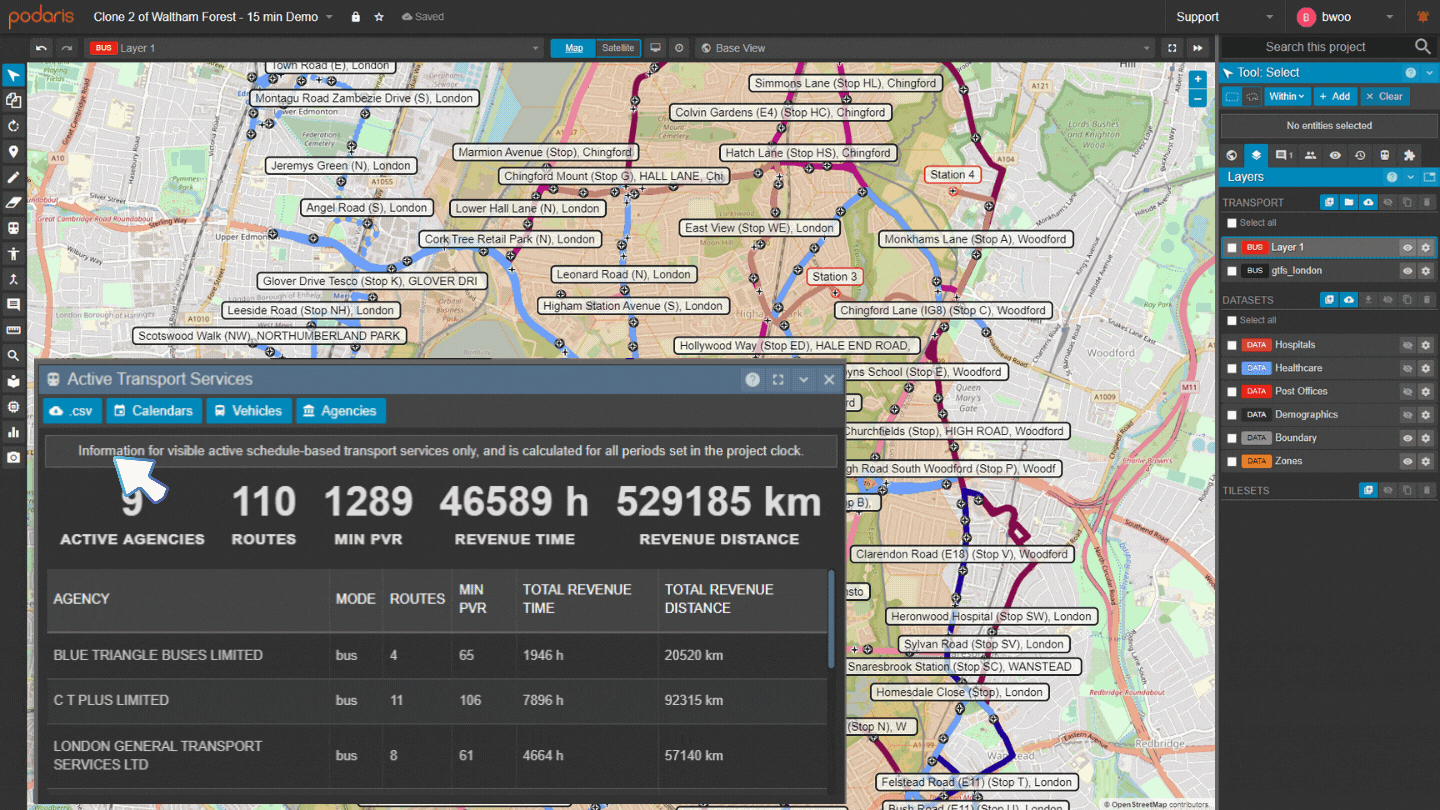
- Key service statistics, broken down for each mode and each agency
- Service statistics for routes produced or imported in Podaris, such as:
- Total revenue time
- Total revenue distance
- Minimum peak vehicle requirements
- Geospatial datasets, included those produced within Podaris
- Comments gathered from project collaborators and external stakeholders
This is an inexhaustive list of the many outputs producible with Podaris. As well as a wealth of exportable statistics, Podaris can ingest a wide variety of data types. We've made editing GTFS and TransXChange feeds fast, simple and visually comprehensible, and made merging, splitting and joining routes and their associated patterns, a one-click affair.
3. Understanding your data
With such a wealth of transit and geospatial data explorable within Podaris, it's important to have tools for surfacing insights rapidly and with minimal complexity.
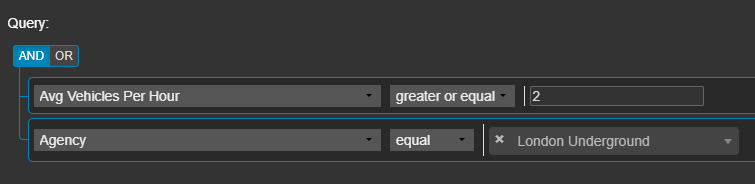
Advanced selection tools allow you to quickly locate all routes within your network operating at a particular frequency. And with tools for the freehand drawing of your selection area, you can now clip a particular region within your network in order to determine how many routes operate at a given frequency.
Similarly, Podaris allows you to isolate only routes that operate a specific number of vehicle trips. By combining these queries, adding, for example, routes operated only by a particular agency, you can set up powerful filters to extract only the data you want, in seconds.
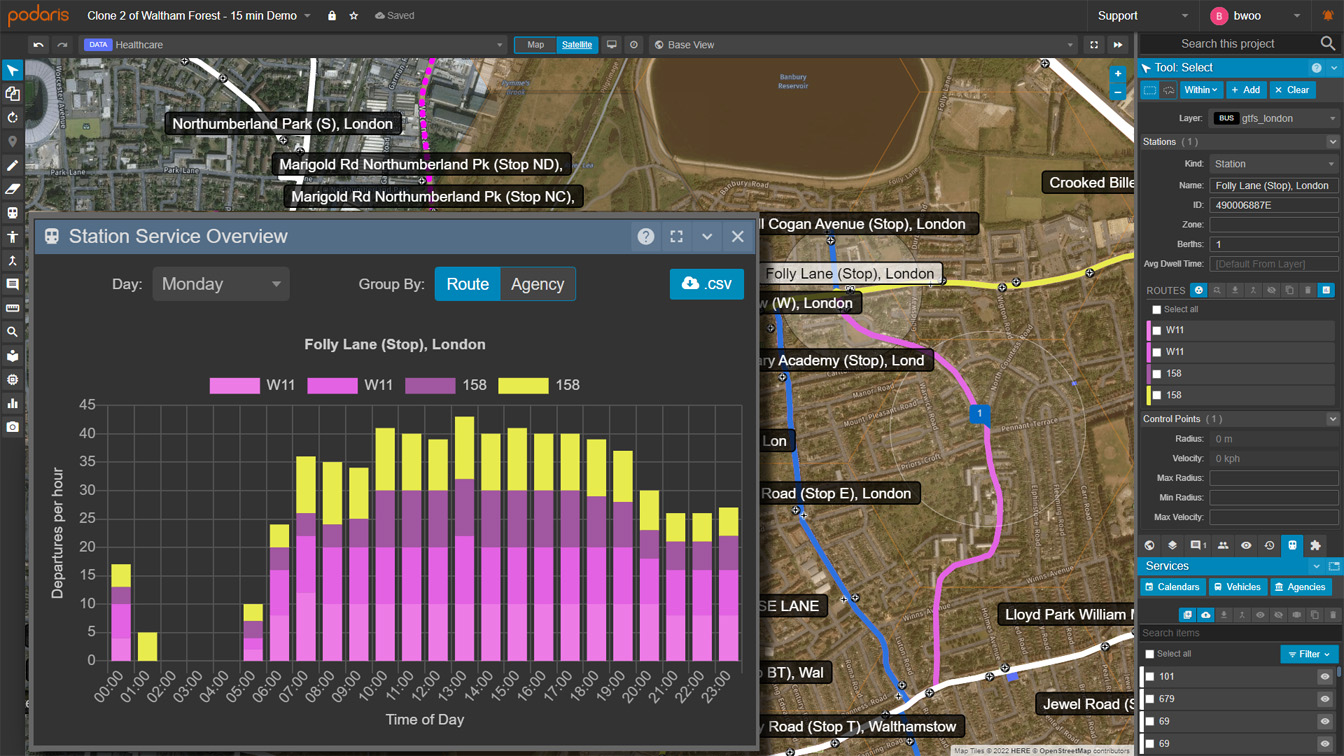
Let's see what kind of information we can extract about a station, with just a couple of clicks… By selecting multiple stations at the same time, we can easily identify which routes either call at least one of our selected stations, or all of them.
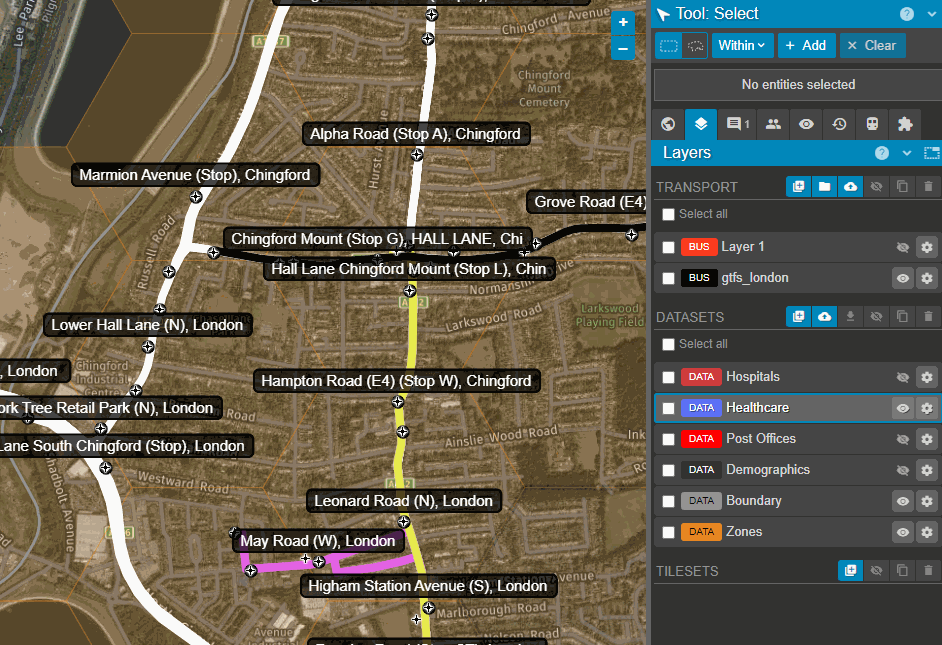
Clicking on an individual stop on our map will allow us to interrogate the stop in greater detail, revealing the number of departures per hour, on a given day. We can use this tool to see which routes or agencies use the stop, how often, and easily identify gaps in our services.
These outputs are a small subset of those producible with Podaris, and as with all calculations performed within the platform, can be generated in moments.
To discover the full capabilities of Podaris and understand how it can accelerate your transport planning projects, get in touch today and schedule a demo with a member of our team.