Following the launch of our rapid accessibility analysis toolkit Podaris:Insight, we recently published an article demystifying the Public Transport Accessibility Metric method (PTAL), a metric that has become a critical tool in evaluating public transport services globally and measures the accessibility of an area based on its public transport services. More specifically, PTAL evaluates the proximity to transport stops, the frequency, and reliability of services.
While PTAL can give us a good general understanding of access to public transport within a region, it is limited in a number of respects, particularly in that it does not take into account where services actually go. In order to understand the connectivity of transit options to the kinds of amenities that matter to people, we can use the new MEP (Mobility Energy Productivity) analysis type bundled with Podaris:Insight.
MEP is a recently devised metric, designed by the National Renewable Energy Laboratory in the US, to provide a more holistic measure of mobility and be adaptable to a wide variety of existing and future transport modes. In this respect, it is well suited to quantifying the potential impacts of investment in services, infrastructure and technology and to promoting a maximum-mobility, minimum-energy future. It has also been designed so that MEP scores can be standardised and compared across locations or schemes.
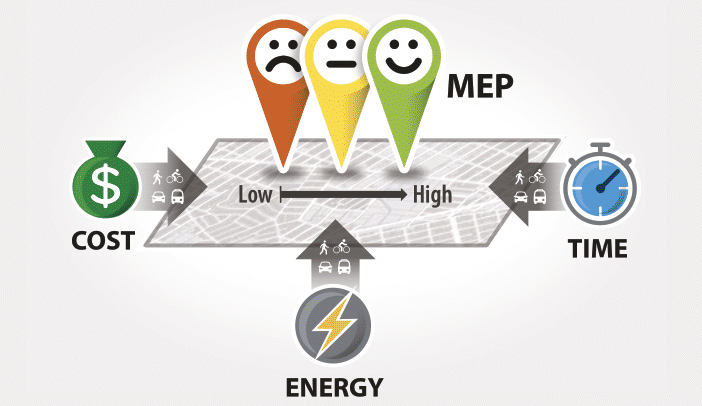
MEP factors cost, energy and time into its scoring calculations, and in Podaris, an MEP score is assigned to each analysis zone in a dataset. Those locations might be a grid of points, hexbins or census tracts.
As well as location, distance and energy, MEP looks at ‘opportunities’, and this allows us to go beyond the limits of PTAL, and explore connectivity to key destinations, such as jobs, healthcare and leisure. By default, MEP will give more weight to frequently visited locations, such as office spaces, and less weight to locations such as cinemas and theatres. These weighting values can be modified within Podaris:Insight, as can the amenities themselves. Podaris:Insight allows you to add these amenities in one of two ways:
- By importing a dataset (or using one created in Podaris:Plan)
- By adding an Overpass query. These are key/value pairs used in OpenStreetMap - for example: amenity:bar, amenity:cafe, amenity:restaurant.
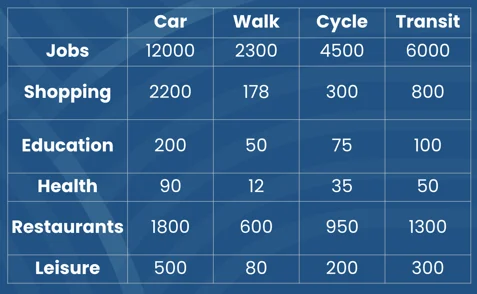
Here we can see the default activities set up for a Podaris:Insight MEP analysis with their respective weightings. We can preview each of these, and visualise the number of features as points, constrained to a boundary that we draw or import.
The next step is to define the modes of travel that we will be taking into account. Here we can use walking, cycling, car, or transit (or all of the above). With transit selected, we can also choose parameters such as the day of travel and departure time. This data is derived from the base network that we select. We can create such networks ourselves in Podaris:Plan, or import them as GTFS or TransXChange feeds. The associated schedules are then used to inform these calculations. As in Podaris:Plan these are multimodal networks and can incorporate everything from bus and train to Personal Rapid Transit (PRT) and hyperloop.
Each mode has associated energy intensity and operational cost parameters that can be tweaked. For energy intensity, this is represented as kWh per-passenger mile, and for cost, dollar per passenger-mile. The default costs for transit and driving are taken from the Federal Transit Administration and American Automobile Association, respectively, and can be modified to your better suit your locale.
How is MEP calculated?
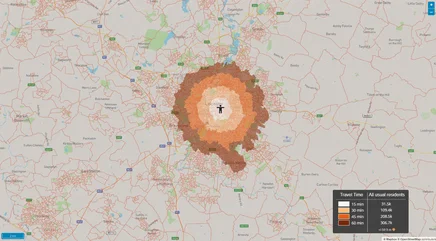
- Firstly, an isochrone is created for each zone and for a number of different travel time catchments (e.g. 10, 20, 30 minutes). These catchments can be individually set in Podaris.
- This is then repeated for each selected mode.
- For each isochrone, we then calculate the number of accessible opportunities.
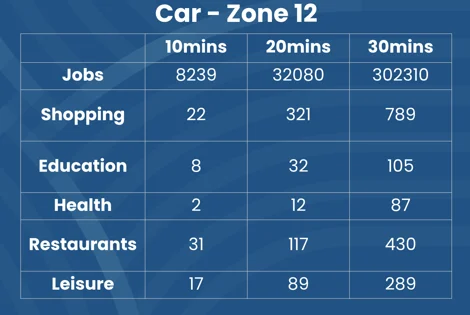
- These are then weight those by time, cost, and energy intensity, to get a per-mode per-opportunity value.
- We then combine these to give a single MEP score per zone.
Interpreting MEP
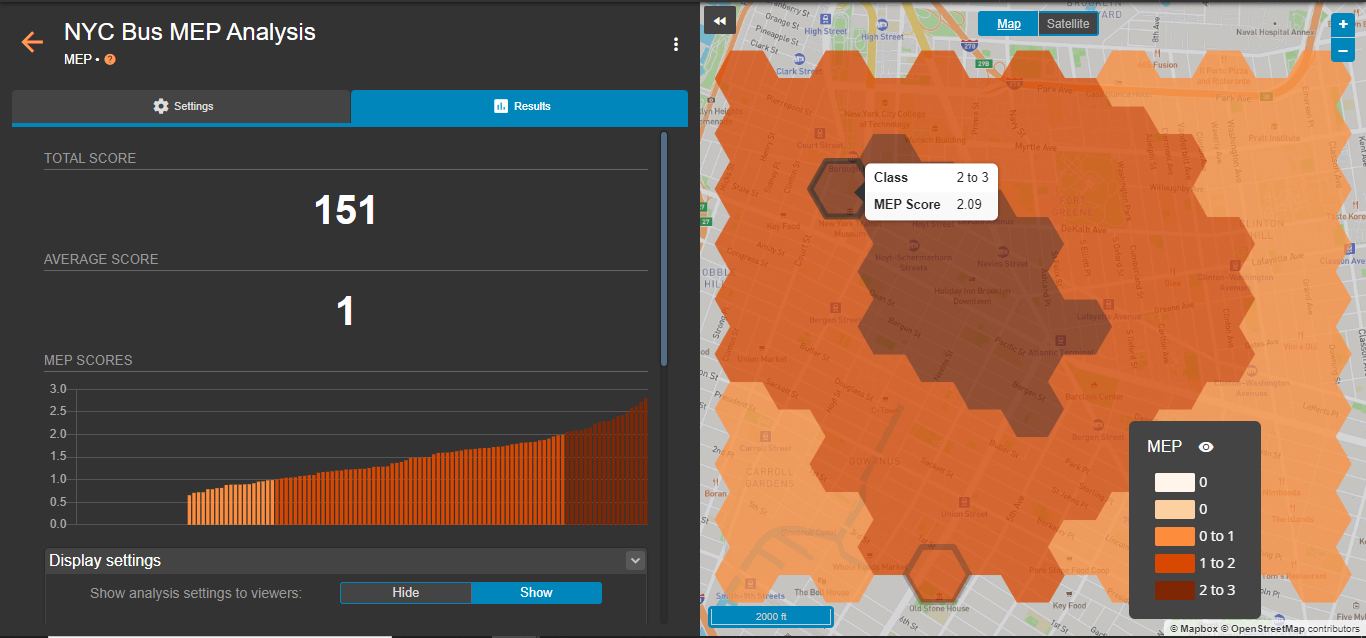
Once the MEP analysis has finished running in our cloud workers, we are presented with a results page showing:
- A map with the MEP score for each zone. The higher the score, the better connected a zone is to the defined opportunities by fast, cheap, and energy-efficient travel options.
- Key statistics and distributions of MEP scores on the left.
MEP is just one of many accessibility analysis types included in Podaris:Insight. For an overview of the application, you can take a look back at our earlier article, here. If you'd prefer a tailored, one-on-one tour of Insight and the entire Podaris, platform, why not schedule a demo with us today?