When we launched Podaris:Plan in 2016, our aim was to transform the way planners plan, with an easy-to-use cloud-based application to enable planning more accessible, equitable and sustainable transport futures.
Since then, we've seen Podaris used around the world to plan everything from city scale transport networks to multi-billion dollar campus expansions. We've worked closely with local authorities, consultancies, transport operators and development planners to understand how they plan, and what outputs are most important to them. The result is the next step in the evolution of the Podaris platform: Podaris:Insight.
Podaris:Insight has been designed to dramatically simplify accessibility analysis, generating reliable insights into the real-world impacts of transport decisions with only a few clicks. It brings together a number of common and emerging accessibility metrics, such as Public Transport Accessibility Level (PTAL) and Mobility Energy Productivity (MEP), unlocking their power on a simple interactive interface.
What is accessibility analysis and why is it important?
Accessibility analysis is a critical part of transport planning. It helps transport planners measure the possibilities and limitations of people's mobility within a region by different means of transport. Instead of predicting what people will do, accessibility analysis measures what they can do.
This information helps planners understand existing mobility systems and can be used to compare the impacts of proposed changes. In other words, accessibility analysis is a powerful indicator of how well a mobility system is serving a community.
Now more than ever, accessibility analysis is at the forefront of many transport schemes and plans. Demand patterns are still unpredictable, emerging transport modes pose challenges for existing models, and powerful cloud-computation is at everyone's fingertips.
Although numerous methods for measuring accessibility now exist, implementing them is often a complex and highly technical process. Podaris:Insight solves this problem by offering planners a simple interface from which a number of accessibility analysis types can be performed in just a few clicks.
What can you expect from Podaris:Insight?
At launch, Podaris:Insight supports ten analysis types:
| Analysis Type | Description | |
|---|---|---|
 |
Accessibility Index | Quantify the accessibility score for a set of locations to selected destinations by a chosen mode |
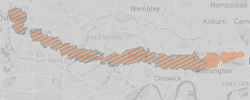 |
Difference | Compare the difference in accessibility between two networks through isochrones |
 |
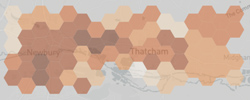
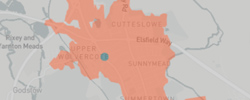
Isochrones | Isochrones are areas that can be reached from a given point within a given time. |
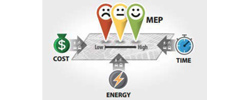 |
Mobility Energy Productivity | Mobility Energy Productivity (MEP) is a measure of how efficiently connected a place is |
|
Multi-criteria Analysis Index | Create a custom method to quantify the accessibility score for a set of locations using multiple factors by a chosen mode |
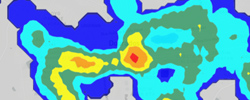 |
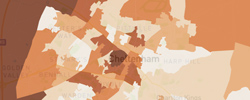
Public Transport Accessibility Level (PTAL) | Public Transport Accessibility Level (PTAL) is a measure of the accessibility of public transport from a given location |
 |
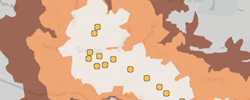
Site Selection | Locate the areas that are accessible from a number of different starting points within a given time. |
 |
Stop Catchment | Isochrone map highlighting regions reachable within a set travel time from network stations. |
 |
Service Level | Measure and compare the public transport service level by frequency for zones.. |
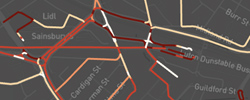 |
Corridor Frequency | Identify which sections of the network have the highest volumes of vehicles. |
A setup wizard accompanies each analysis type, requiring only a few parameters to be set (name, a base network, locations, etc…), before Insight does the rest.
While your choice of metric will depend on the outputs that you're looking to create, each of the above analyses can be performed in just a few minutes. Just drop in your transport network (this can be as simple as dragging and dropping a GTFS file), and each analysis type is ready to go with customisable default settings.
The visualisations that you create can be shared with collaborators who can be invited to the platform as viewers of your project. If you'd prefer to export your outputs for use elsewhere, they can be downloaded as GIS files or as a .CSV.
How does Podaris:Insight differ from Podaris:Plan?
Those who have used isochrones within Podaris:Plan will find a simplified interface here, allowing you to visualise the areas reachable from a given point, within a given time frame. As well as making isochrone analysis simpler, we've also made isochrones much more customisable, easier to share and easier to work with in external GIS tools. We're also supporting analysis of much larger networks.
The ‘difference’ analysis expands on traditional isochrone analysis by allowing you to compare two different networks and determine the difference in accessibility between them. By default, this includes the area covered and the number of accessible stations. Once you've combined datasets, such as census data, you can also start to explore the number of residents served, for example.
The new Site Selection tool locates the areas that are accessible from a number of different starting points within a given time, and the Accessibility Index allows you to quantify the accessibility score for a set of locations to selected destinations by a chosen mode.
PTAL, common to transport planning in the UK looks at accessibility to public transport stops (taking into account the frequency of services at those stops), and the “Multi-Criteria Analysis Index” allows you to create a custom method to quantify the accessibility score for a set of locations using multiple factors by a chosen mode.
Finally, Mobility Productivity or MEP, measures how efficiently connected a place is and takes into account factors such as travel time, cost and energy. We'll explore these metrics in more detail in future blog posts and describe their relative advantages and limitations.
Want to learn more about Podaris:Insight?
Insight is available to all existing enterprise users now. To learn more about Podaris:Insight, and the complete Podaris platform, schedule a demo with us today to discover a faster, smarter and more collaborative way to plan.
As we continue to develop Podaris:Insight, we will be adding further analysis types, but as always, would welcome any feedback on what you’re loving, and what you'd most like to see in future updates. You can contact us directly at info@podaris.com.