Today we are pleased to announce a Podaris plugin for QGIS, and a new “pin isochrone to view” feature. Together, these allow you to combine the collaborative agility of Podaris with the analytical capabilities of desktop GIS software.
First, some background terminology:
-
Isochrones are a great way to visualize spatial connectivity from a given location, and are one of the most-used tools in Podaris. Podaris’ physics-based modelling features ensure that the travel-time calculations are highly accurate.
-
Views are a way to present different aspects of a project. By showing or hiding layers and saving that state as a view, you can present different options or stages of project development. Views can also be shared with stakeholders via Podaris:Engage.
Until now, however, there has been no way to share isochrones in Podaris:Engage. So although isochrones were useful for planners and engineers doing network analysis in Podaris:Plan, they could not be communicated to stakeholders. Our new “pin to view” functionality changes this. By pinning an isochrone to a view, you can make the spatial accessibility an intrinsic part of the view. (Check out this proposed Automated Transit Network in Australia to see pinned isochrones in action).
Isochrones show you how far you can travel in a given amount of time. But often you’re interested in more detailed questions like “How many people can I reach?”, “How many more jobs do I give access to?” and “How many hospitals are in a 30 minute journey from this station?”.
These questions can now be answered using the new plugin for QGIS.
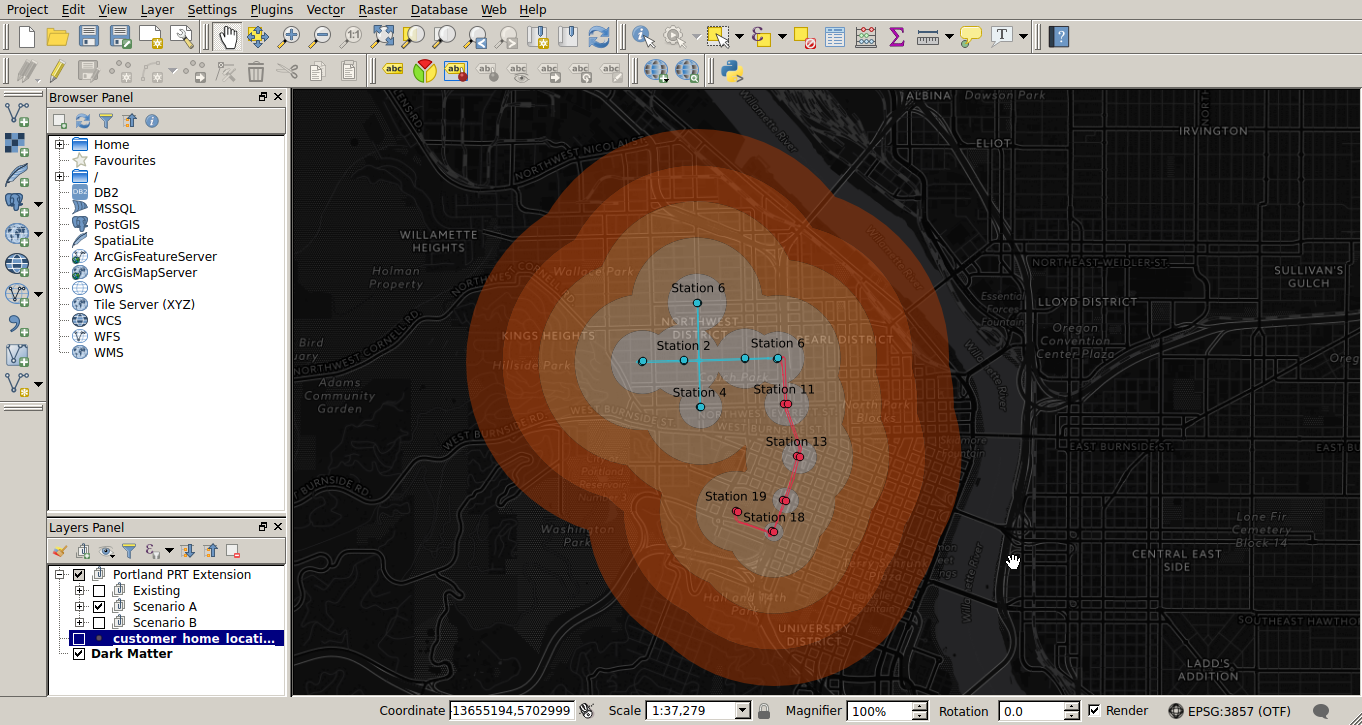
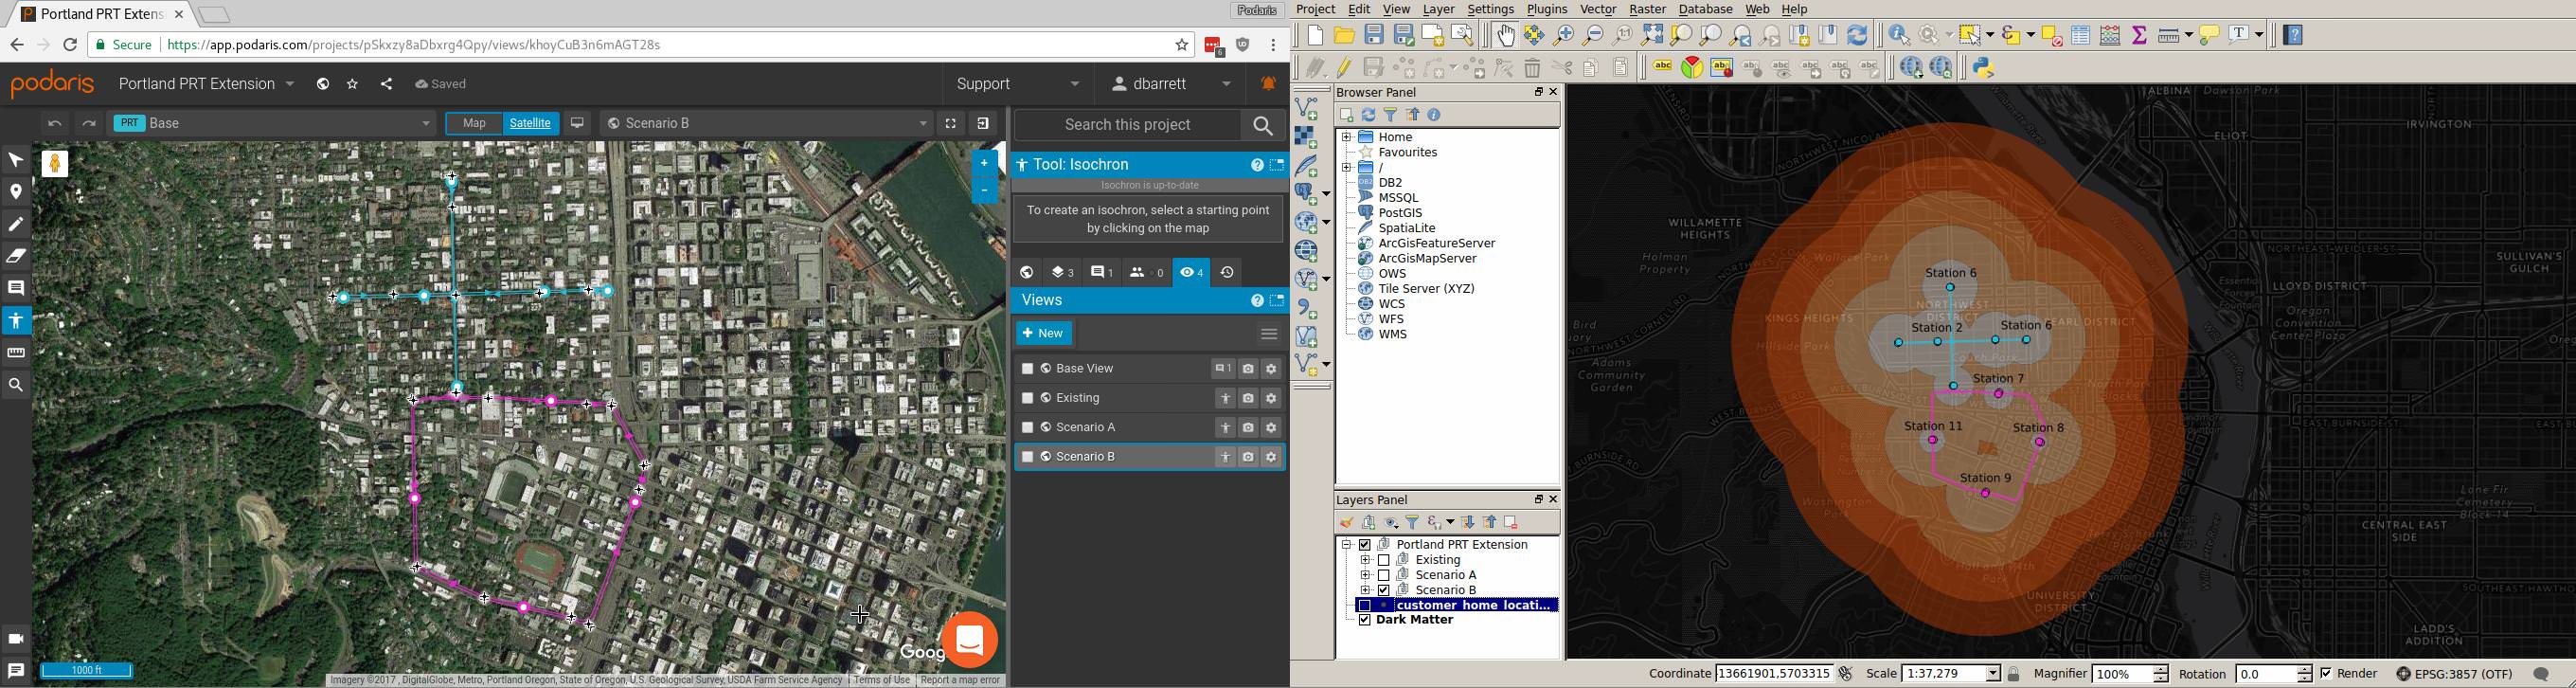
QGIS is a powerful, free, open-source Geographic Information System application. Our plugin lets you import a view from a Podaris project directly into QGIS – including route geometry, stations, and any pinned Isochrones. You can then use the isochrones to perform sophisticated geospatial queries.
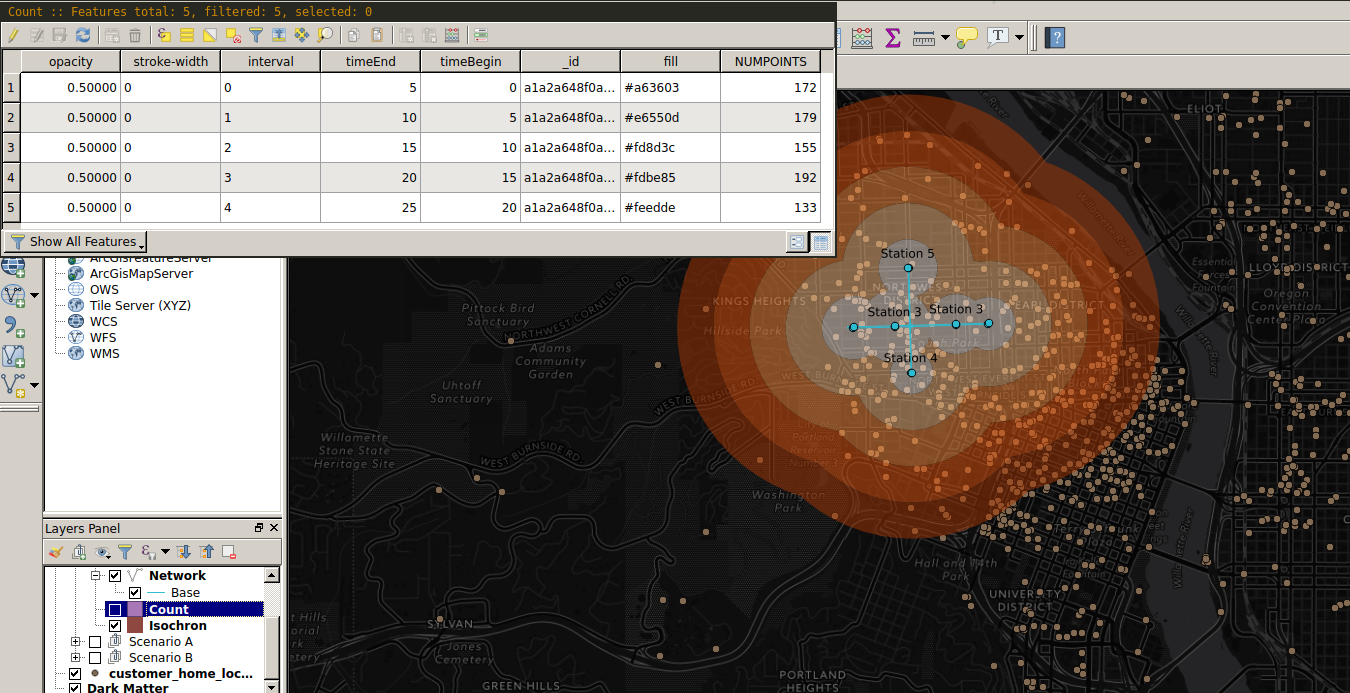
For example: here we have a data layer that shows the location of coffee shops in Portland, Oregon. Using a “points in polygon” query, we can find out the number of coffee shops within a 25-minute commute from our central station. (In Portland, the key metric for any transport system is coffee shop accessibility…)
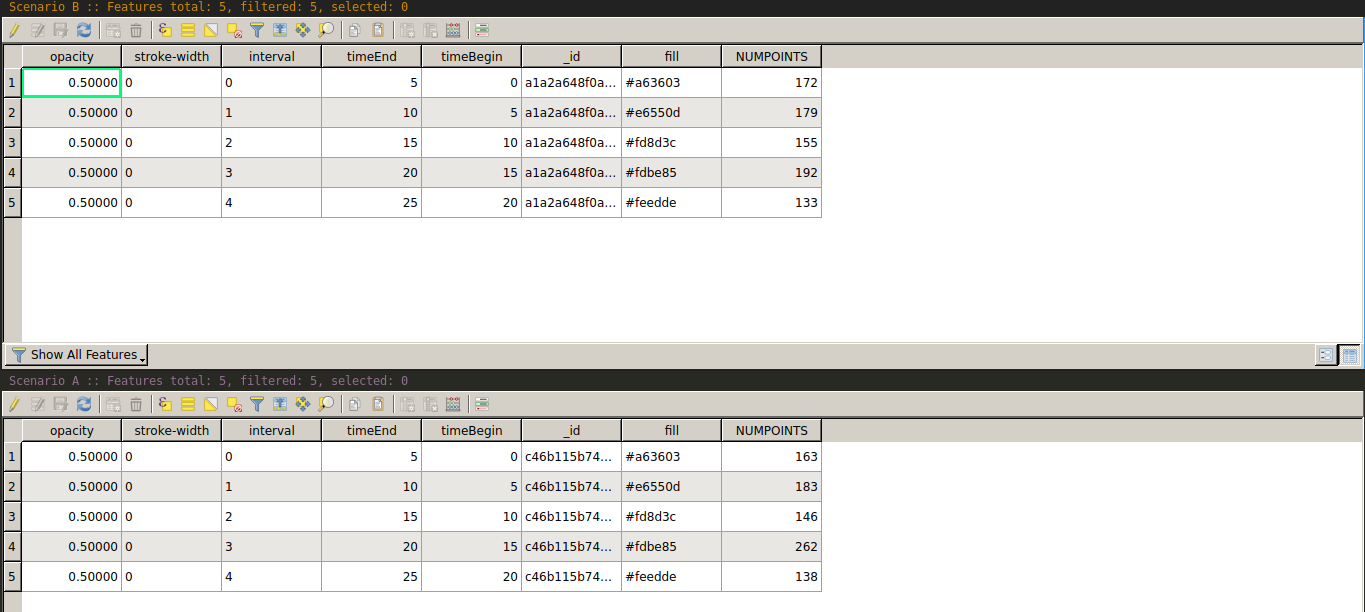
We can take this a step further, comparing two different proposals for extensions to the network. First we create two views – Scenario A and Scenario B – with isochrones pinned to the same location in each.
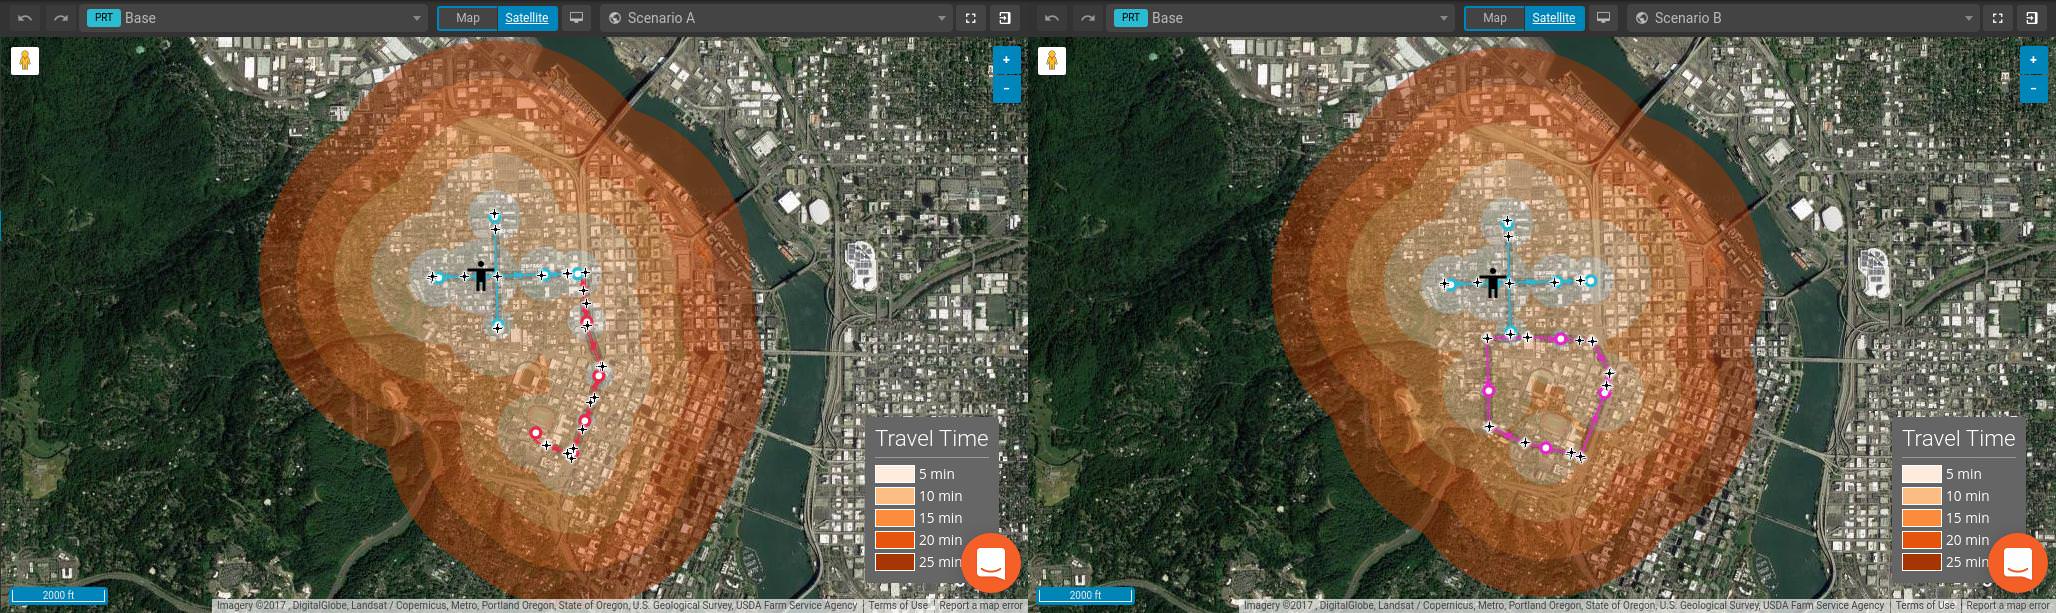
Those can be imported into QGIS, and the same query as before run against them, showing that Scenario A gives access to more coffee shops (892) than scenario B (merely 831).
This is just the beginning. The QGIS plugin allows the full power of desktop-based GIS to be applied to Podaris projects – without sacrificing the ease-of-use, web-based accessibility, or collaboration capabilities of Podaris. Even if you’re not a GIS expert yourself, this plugin allows easy collaboration with GIS experts – fulfilling the Podaris vision of seamless interdisciplinary collaboration.
Over the coming weeks we’ll be adding more features to the plugin, including automatically synchronising updates from Podaris. Let us know what other functionality you would like to see!
Get the QGIS plugin here: https://github.com/podaris/qgis