What is PTAL and why is it important for transport planners?
Developed in 1992 by a West London borough, the Public Transport Accessibility Level (PTAL) method is a measure of how well-served different areas are by public transport. Now the standard method for calculating public transport accessibility in London, it has seen adoption around the world, from India to Australia, as well as derivatives such as Transport for Greater Manchester's Greater Manchester Accessibility Level (GMAL).
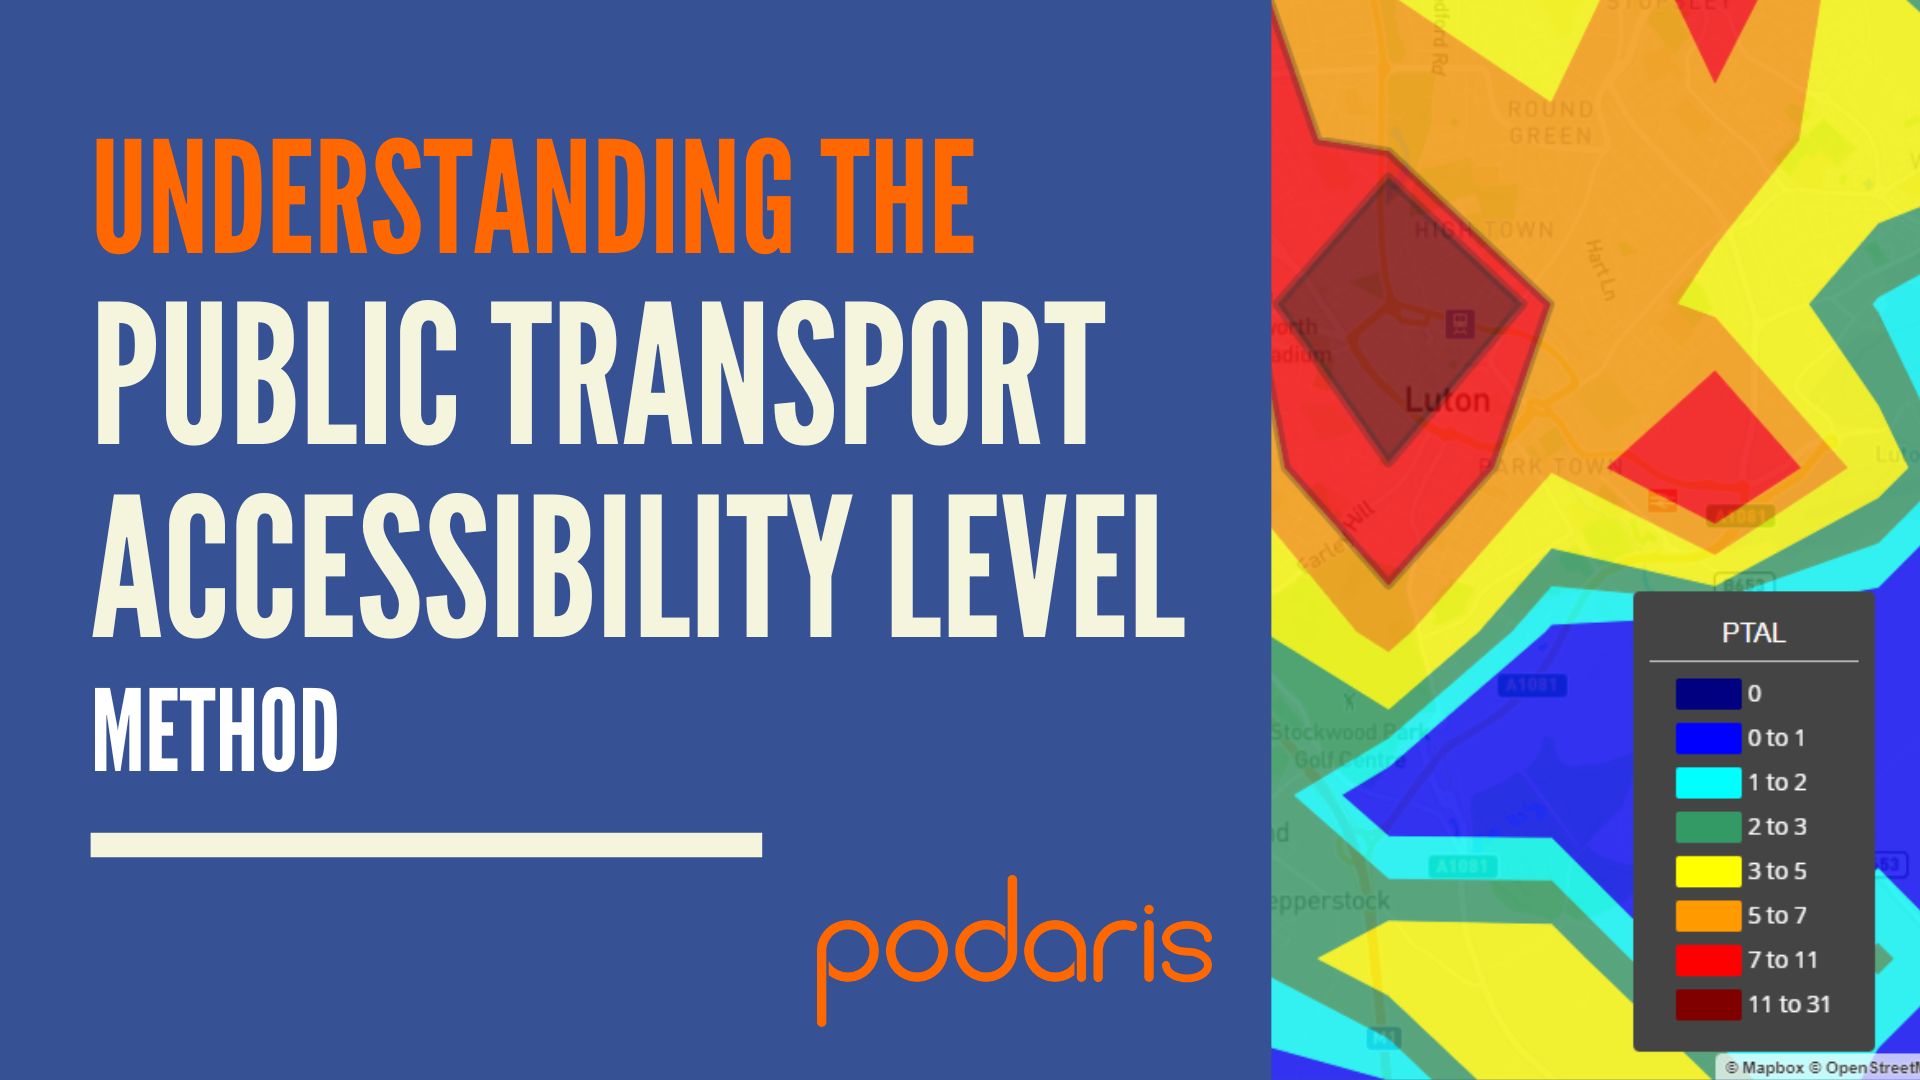
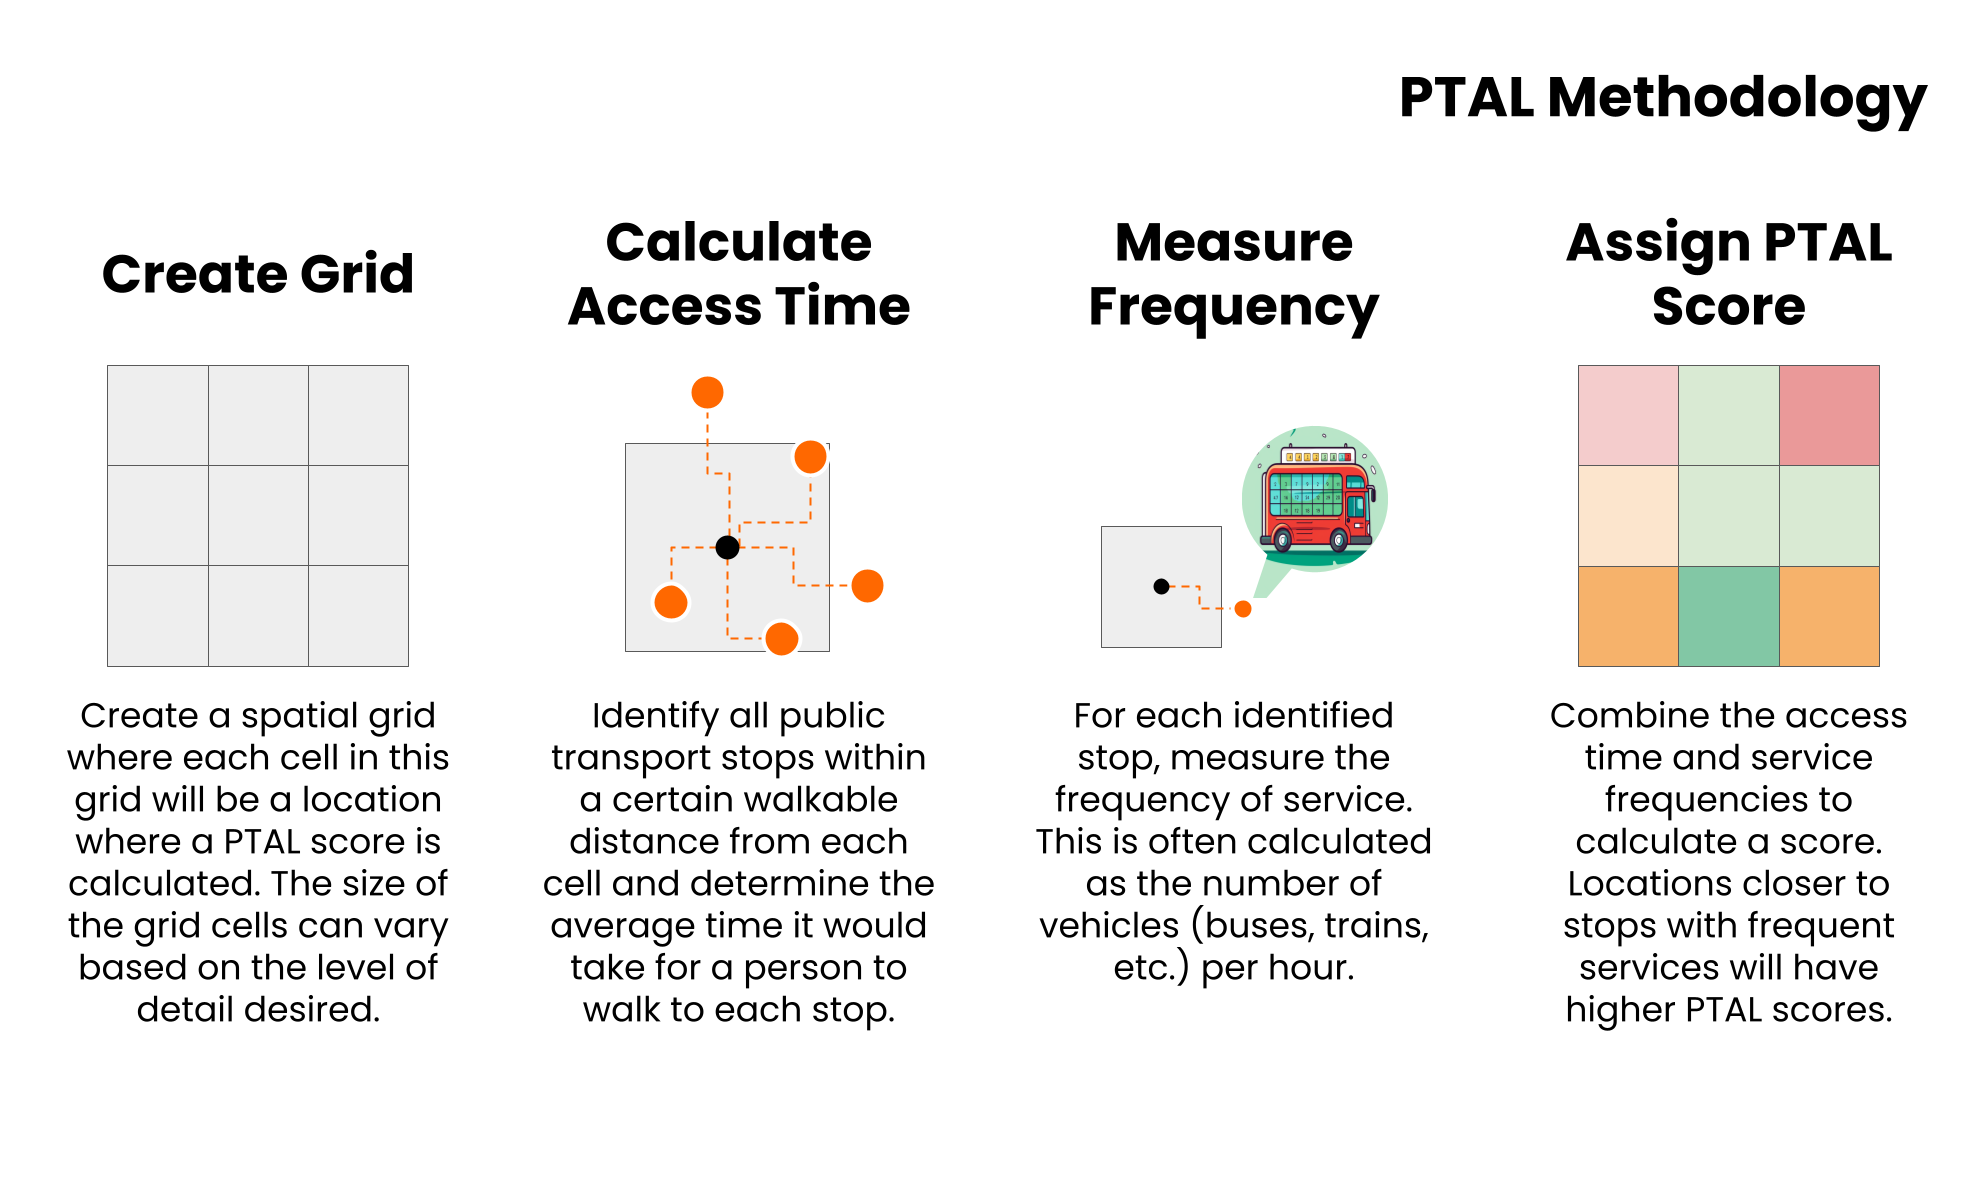
The method for calculating PTAL scores is fairly straightforward and is based on the distance to the nearest public transport stop from a given point, as well as the frequency and reliability of the services using that stop. Each point is then awarded a score from 1 (extremely poor access) to 6 (excellent access), with subdivisions 1a, 1b and 6a, 6b.
As a general indicator of the connectedness of an area, it serves as a useful tool for transport planners to identify areas of transport poverty. What PTAL can't tell us, however, is where services actually go - and so no distinction is made between a bus service that runs to the end of the road and one that reaches the city centre. In fact, if the former is more frequent, it will score more highly with the PTAL method.
Furthermore, using arbitrary cut off points when dividing an area for analysis may result in two adjacent regions being given dramatically different PTAL scores, even if the time required to walk from one to the other is insignificant.
Nonetheless, PTAL remains a popular method of accessibility analysis, in some part due to the ease of performing these calculations by means of spreadsheets. But what if you need to rapidly generate scores for a range of locations?
Calculating PTAL scores with Podaris:Insight
This November, we launched the latest application for the Podaris platform - Podaris:Insight. Designed to dramatically simplify accessibility analysis, it unites a wide range of accessibility methods in one, easy-to-use cloud-based toolkit. Among the analysis types available to Insight users is PTAL, which can be set up and calculated in minutes, using a wizard pre-loaded with convenient defaults. In fact, the only requirement is that you provide your baseline network, and Podaris takes care of the rest.
The process of calculating PTAL scores in Podaris is simple:
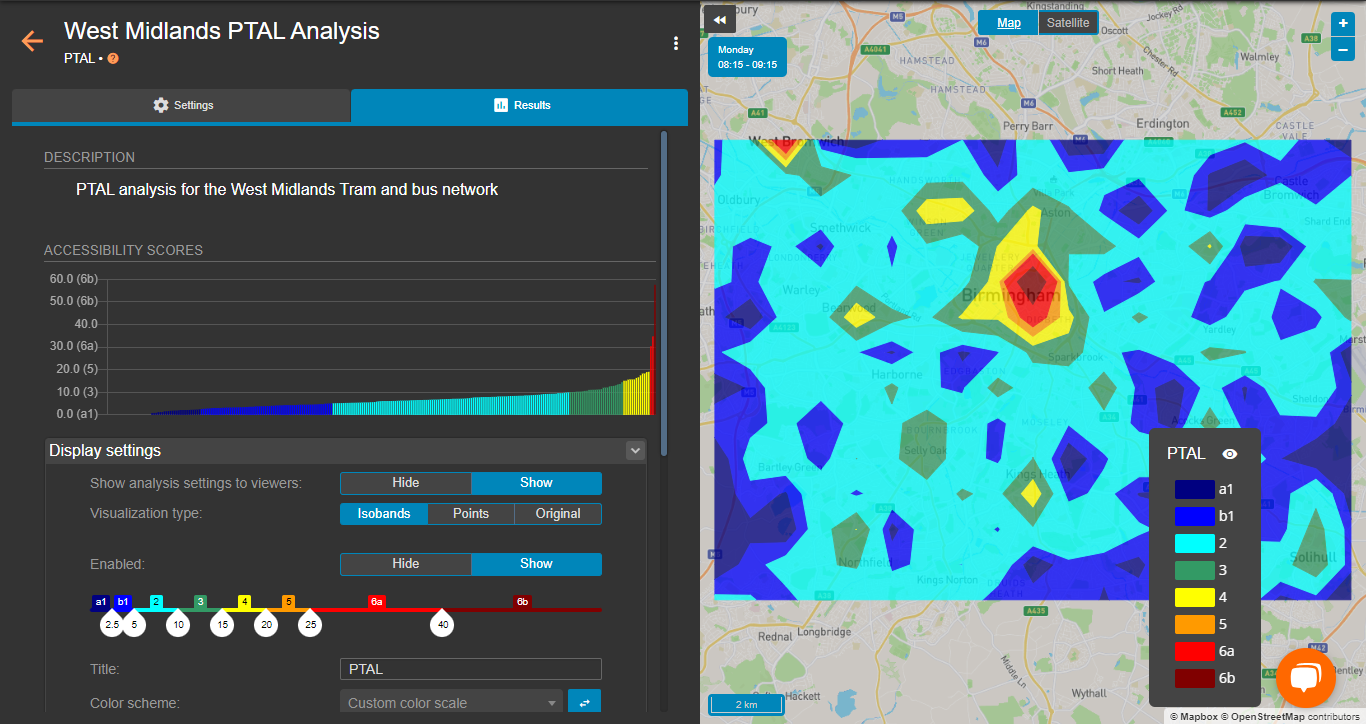
- First load in a base network. This can be a multimodal transport network constructed in Podaris:Plan, or one imported as a GTFS or TransXChange feed. In this case we're looking at the West Midlands Metro - a tram network connecting Birmingham and Wolverhampton in England and the regional bus service.
- We can now define the points on our map for which we'd like to generate PTAL scores. We can do this by uploading a dataset, or create a grid manually in Insight (as below).
- Next we select the day and timeframe that we want to use for our analysis.
- Finally, we choose which transport modes to include. In this West Midlands Metro scenario, we're looking at bus and tram.
As mentioned, reliability of service is also an important factor in PTAL calculations, and can be added on a per-mode basis here. We can set a value (2 minutes by default) to be added to the average wait time on a stop.
And that's it! We click run and Podaris generates a visualisation of the selected area, subdivided according to our specifications (points in this case, visualised as isolines) and with each subdivision awarded a PTAL score. An accompanying chart gives us an overview of the distribution of these classes across our region.
Customising PTAL bands
The default setting for each band is based on Transport for London's guidance on ‘access index ranges’ for PTAL calculations to ensure standardisation. A particularly powerful feature of Insight however is the ability to adjust the lower bounds for each class to your liking, either with the on-screen sliders or by inputting a value into the corresponding text box.
The visualisation is redrawn in real-time as you make these changes.
Our PTAL visualisation can then be exported as a high resolution image or a GIS file, in a variety of formats (GeoJSON, KML, etc…). If you'd prefer to share your visualisations from within Podaris, you can invite collaborators through a secure stakeholder engagement interface.
Take a look at our video guide, below, for a complete walkthrough.
We've already seen a number of users explore the benefits of PTAL analysis in Podaris:Insight since launch. As one user says, “I think the PTAL tool is really useful. Ive tried doing this sort of analysis before on standalone GIS and found it a challenge so this makes things much easier.”
If you're interested in exploring accessibility analysis further, we'll be hosting a free afternoon webinar this November 28th at 15:00 GMT, during which we'll explore some of the key features of Podaris:Insight and answer any of your questions.
Sign up for the Podaris:Insight webinar
If you'd prefer a one-on-one tour of the Podaris platform, head over to https://www.podaris.com/schedule-a-demo and schedule a demo with us today!