Over the past few months, we've been fortunate enough to finally step out from behind our screens and attend a number of the recent transport events hosted around the UK. While online events and webinars have necessarily filled a gap during the wax and wane of COVID, physical events represent a unique opportunity to meet, greet, educate and inform.
In June, we attended the 2022 PTRC Transport Practitioner's Meeting at the UK's University of Greenwich. The two day event drew a wide variety of transport practitioners, speaking on topics such as accessibility and inclusion, data collection methodologies, active travel schemes and sustainability. Podaris hosted an interactive workshop on day two, focusing on how to build more equitable bus services in the context of the UK's National Bus Strategy (NBS).
We've covered the National Bus Strategy, Bus Service Improvement Plans (BSIPs), and even took a cursory look planning for more equitable and inclusive services in previous blog posts. Since then, BSIP funding has been allocated to (some) Local Transport Authorities (LTAs) around the UK, with 48 of 79 LTAs receiving no funding. A dramatic reduction in the total amount of available funding (from £3bn to £1bn) resulted in awards ranging from £2.6m to £163.5m, with the largest allocations going to combined authorities.
We've had the opportunity to support a number of BSIPs and network reviews this year, helping to provide evidence for successful applications that we hope will lead to improvements in public transport across England. In doing so, we've seen first-hand some of the challenges inherent in developing services that are faster, more frequent and provide better connectivity. During our TPM workshop, we decided to explore some of the assumptions held by the event's attendees by anonymously polling participants as we went along.
Understanding transport inequality in the UK
In order to understand how best to create more equitable public transport networks, it's important to understand where and how inequality exists and the value inherent in tackling those inequalities. Currently, in cities outside London, 77% of jobseekers do not have regular access to a car, van or motorbike. Furthermore, bus users are disproportionately from less advantaged social groups and areas, and women and minority groups are overrepresented within those disadvantaged groups. It is also true that disadvantaged groups typically have more diverse travel needs.
There are many benefits associated with creating more equitable networks, foremost that they:
- Facilitate social inclusion and wellbeing
- Connect job seekers to job opportunities
- Connect everybody, not just those in urban areas
- Are affordable enough to allow those on very low incomes to use it
- Are reliable and frequent enough to depend on for regular trips
Our workshop invited attendees to fire up their laptops and access the Podaris platform to plan and analyse a network, guided by their responses to a series of questions such as:
- What disadvantaged group should the the analysis focus on?
- What do they believe constitutes a high frequency service level?
- Which type of point of interest is the best indicator of accessibility for our disadvantaged group?
- How should we improve frequencies?
- How should we enhance services?
Our workshop focused on Slough, a town with 150,000 inhabitants, where most residents are within 400 metres of a bus route. Slough has a higher percentage of zero-car households than neighbouring Berkshire but only one bus service that provides a ‘walk-up’ frequency of 5-6 buses per hour. Unfortunately for Slough, Slough Borough Council were among the 48 not to receive any BSIP funding.
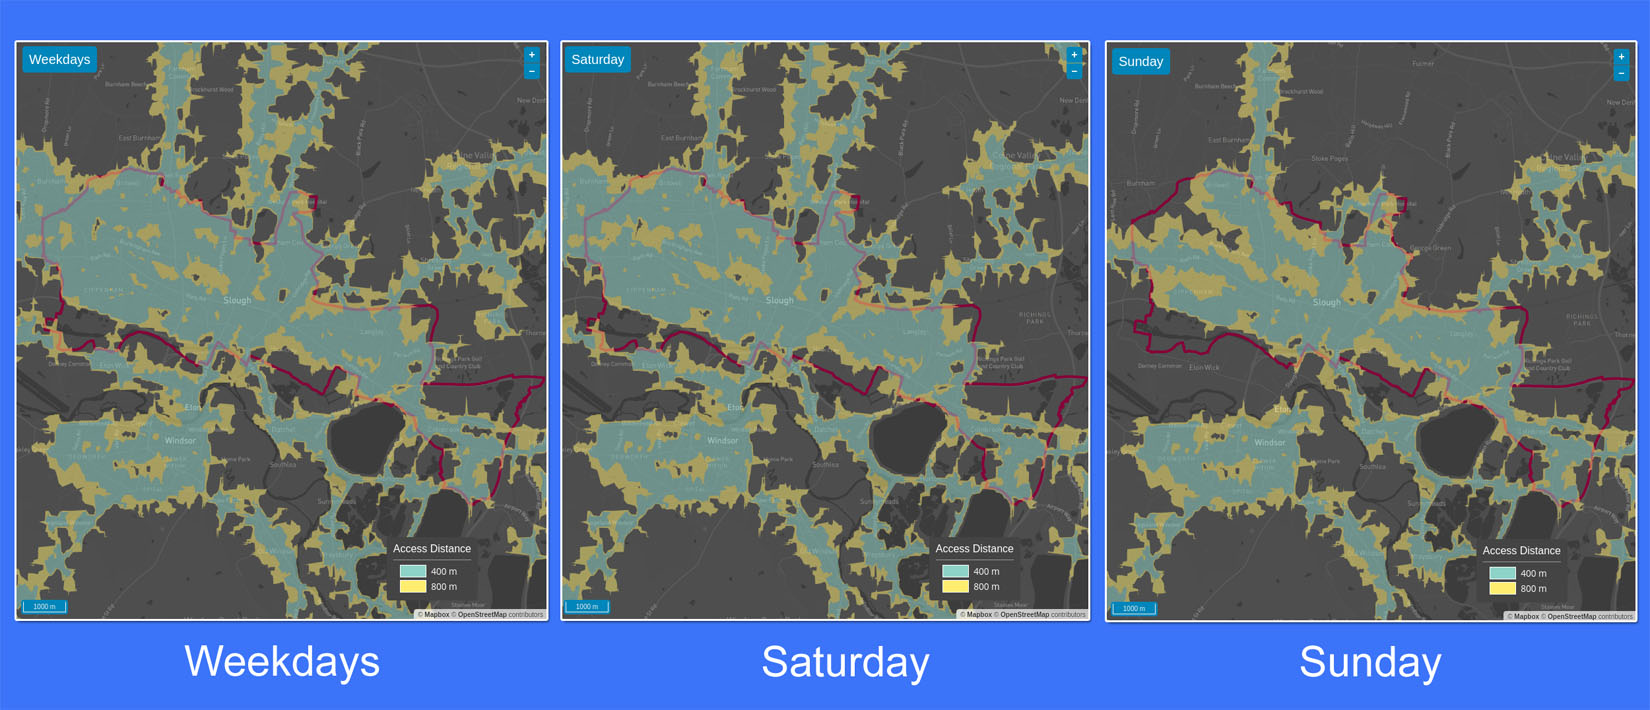
Once they had logged onto the platform, users accessing our Slough BSIP base project could immediately begin to explore existing network access across weekdays and weekends with street-based isochrones indicating accessibility for both 400m and 800m access distances.
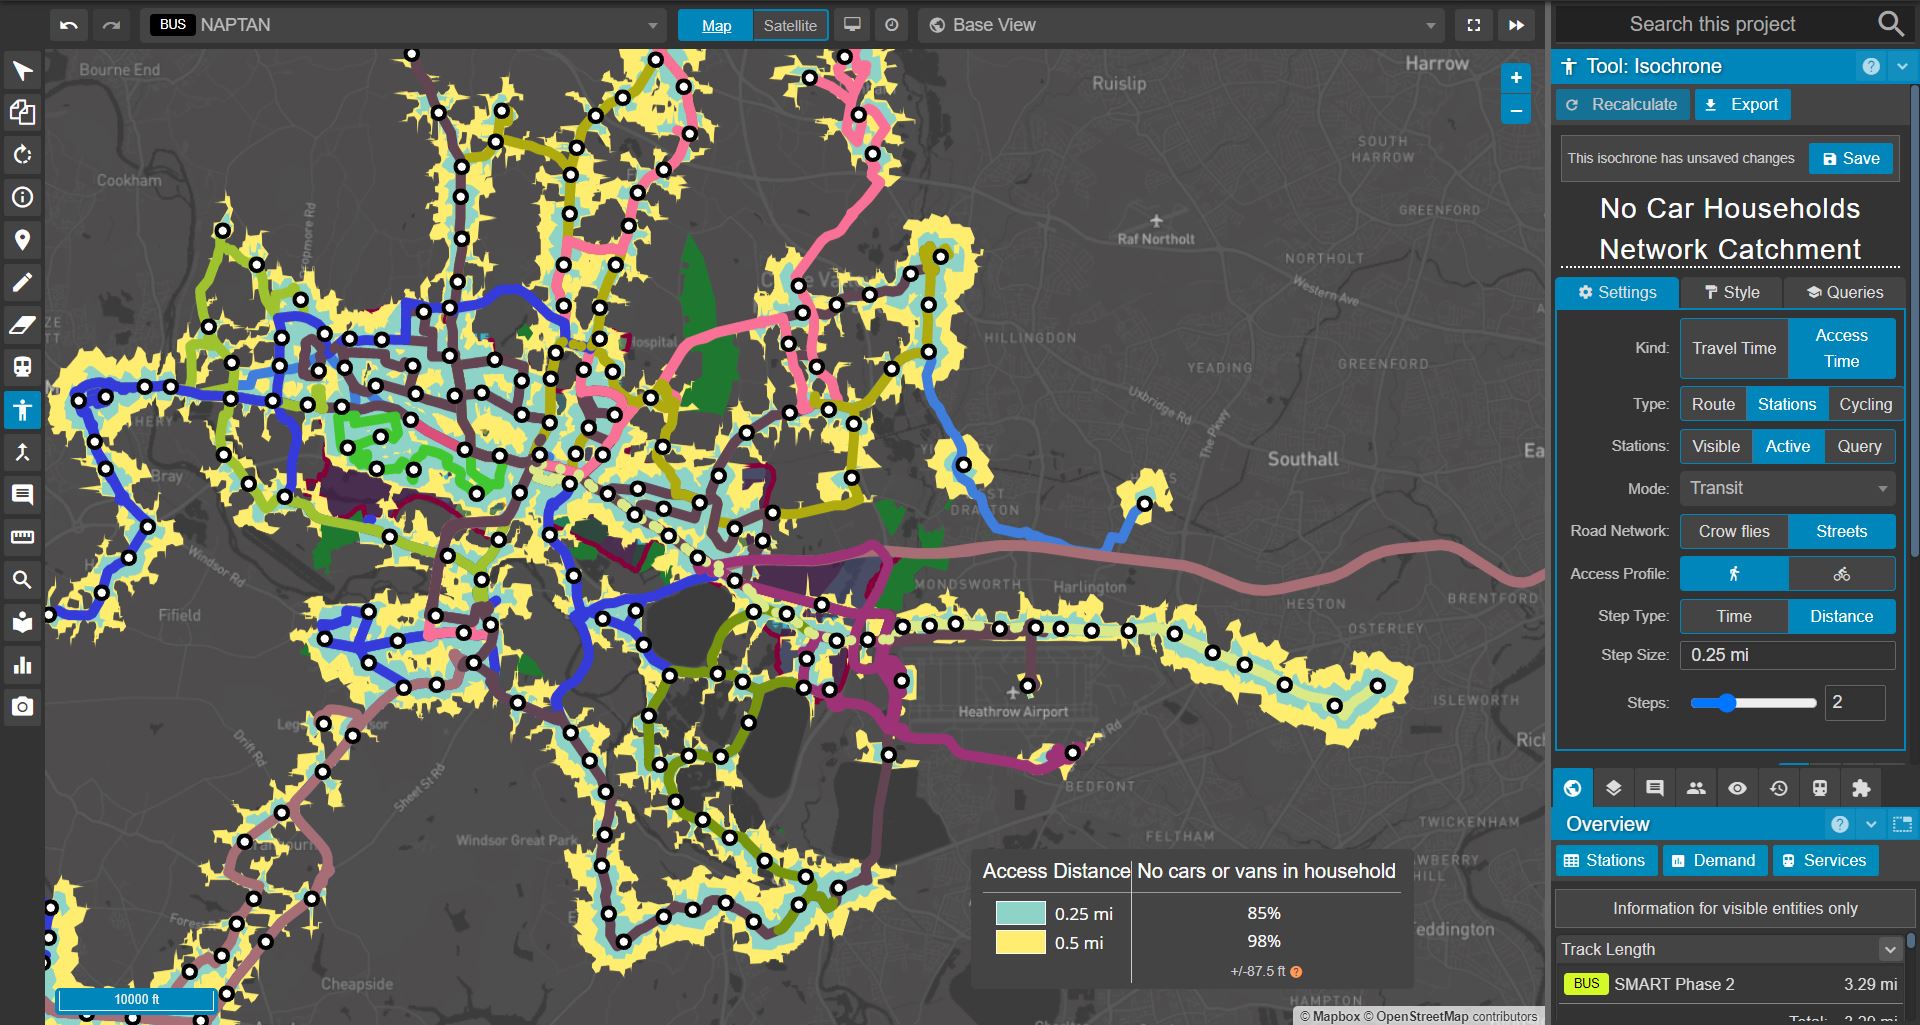
When polled, the majority of participants chose ‘no-car households’ as the best group with which to quantify network access in this context. The type of isochrone analysis shown above can be easily recalculated to include any kind of demographic data in just a few clicks within Podaris, and we can easily visualise accessibility across the network for households without access to a car. By doing so, we discover that over 98% of the car-fee households in Slough live within 0.5 miles of a bus stop - not bad!
However, simply living within walking distance of a bus stop is of limited value if that stop is only served infrequently. A key requirement to fulfilling the aims of the NBS was to improve the frequency of services, especially in the evenings and weekends.The majority of funded BSIPs proposed ambitious frequency improvements to evening services. We asked workshop attendees what they thought constituted a high frequency service level. The majority answered >6 vehicles per hour (every 10 minutes).
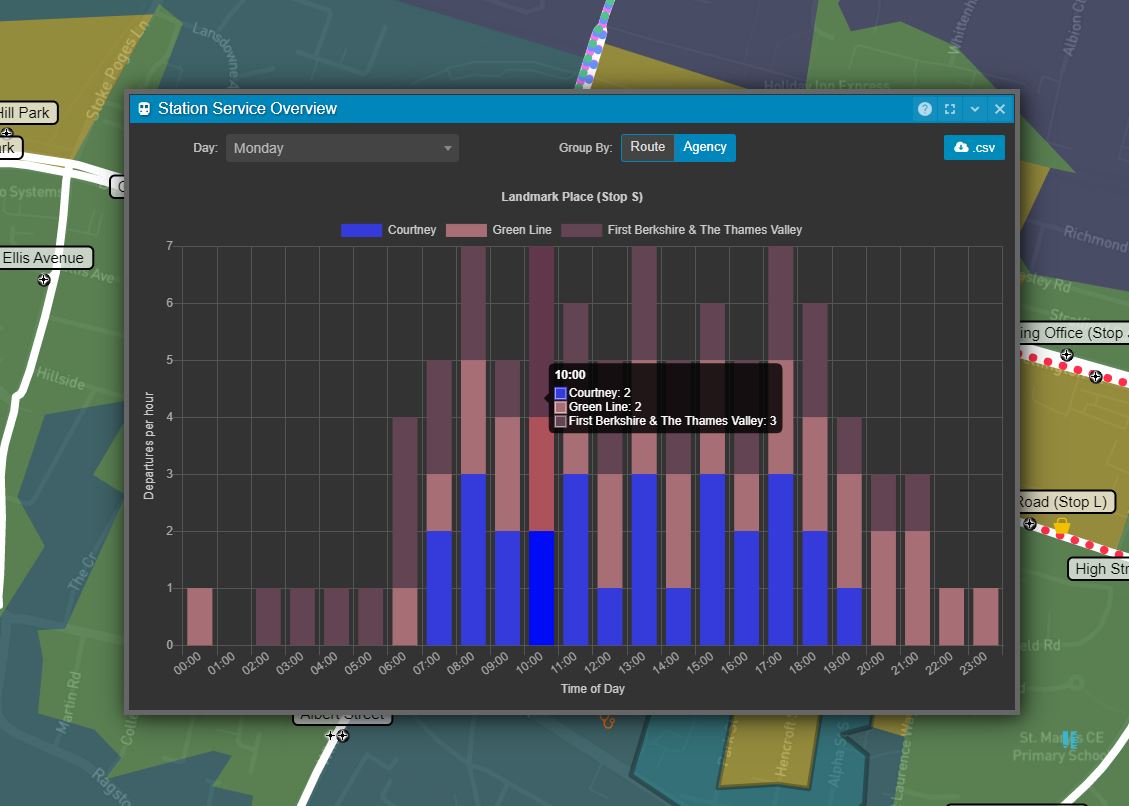
Tools for assessing the number of departures per hour from a given station, on a given day, allow you to use Podaris to instantly identify gaps in a service and group those departures by route or agency. Then, in combination with the powerful isochrone query editor, we can begin to explore access to services running at various frequencies at different times of the day and week to build a more complete picture of access across the whole network.
For example, rather than just looking at how many car-free households in Slough can walk to a bus stop within 0.5 miles, we can extend that question to find out how many of those can walk to a bus stop with a Sunday Evening frequency of a bus every 10 minutes or better.
Connecting people to places
But we can go further. As with the Public Transport Accessibility Level (PTAL) method, this type of analysis does not give us any real insight into how well connected people are to the places they want to go. To build an understanding of that, we can start to calculate connectivity to key destinations. So, which type of point of interest is the best indicator of accessibility for our disadvantaged group? We suggested: supermarkets, town centres, primary schools, doctors, hospitals and public parks and gardens. The overwhelming majority said town centres.
Using isochrone queries, we can quickly target features on a dataset layer, such as the location of town centres within a region, and quickly recalculate our isochrones to visualise how many people are given access to those locations from their homes using the existing network. With Podaris, we can very quickly modify existing route properties to quantify the benefits of changes to service frequency.
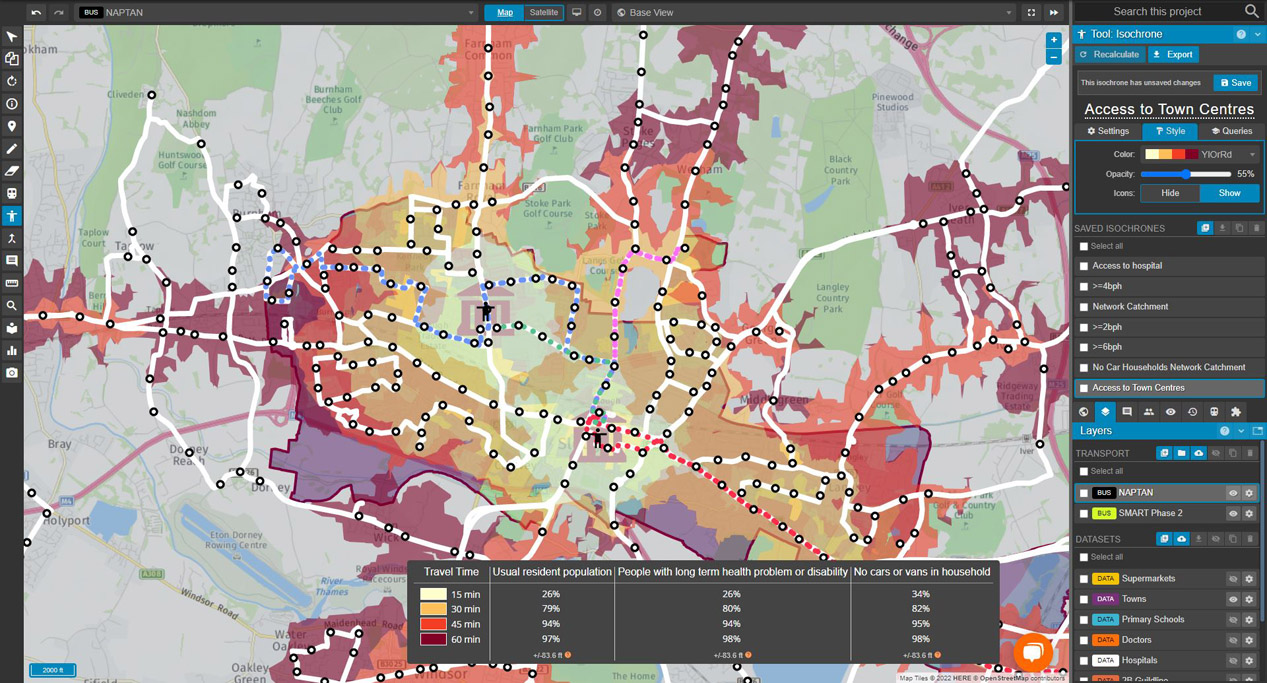
During the workshop, we gave attendees the opportunity to experiment with similar types of schemes to those identified by Slough as part of its BSIP. Package 1A involved increasing the frequency between Slough town centre and Wexham Park Hospital to every 10-min daytime and every 20-min evenings and weekends. Attendees chose package 1B, which sought to increase the daytime frequency of route 12 to 30-min, extend into evenings with a 60-min frequency, and start operating a Sunday service.
We can achieve this in just over a minute in Podaris with the following steps:
- Open route 12 from our list of services
- Enter the new desired trip frequencies and press enter
- Duplicate the weekday trip and change the headway and times
- Duplicate the Saturday trip and change the calendar to Sundays
A second proposed scheme (2B), chosen from two options (the other being a high-frequency bus rapid transit solution) was to simplify services by merging the 1 & 13 to provide a more direct offering. Again, this is the work of moments on Podaris, using its pattern editor, which allows the process to be completed in around a minute (shown in the video below).
Implementing all of these packages and comparing with a ‘do-nothing’ situation, using the isochrone analysis tools described above, we can very quickly build a table that gives us an at-a-glance overview of the effectiveness of our proposals.
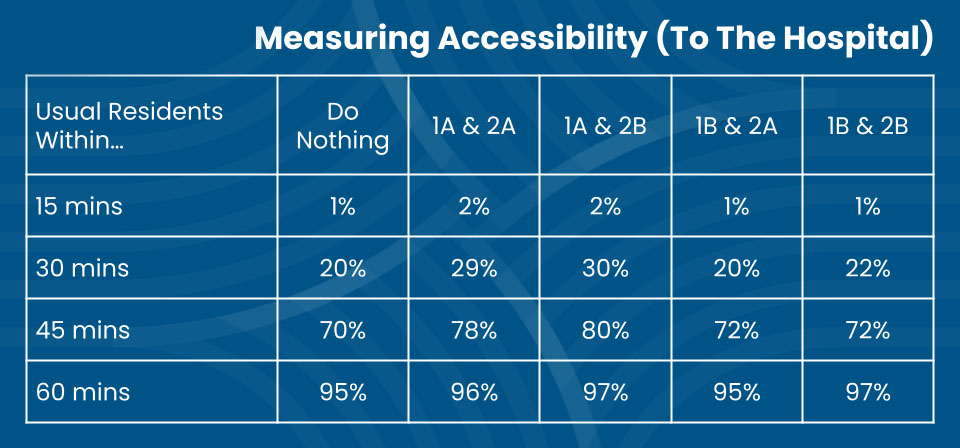
We can see just how rapidly modifications to existing services can be planned and analysed in Podaris, generating high-level supporting evidence for documentation such as BSIPs. We hope to be in attendance at events around the country in coming months but if you'd like to experience Podaris first hand and understand how it can help your team accelerate their transportation projects, get in touch and schedule a demo with us today.