In the 16 years since its origins as one Google employee's side project, GTFS, or General Transit Feed Specification has become the standard data format for public transportation schedules and their accompanying geographic information. The specification is represented as a collection of text files, with information such as stops, routes, trips and spatial entities in the form of shapes. Typical applications include journey planning, accessibility analysis and analysis of service provision.
While GTFS feeds are now ubiquitous (the Mobility Database catalogue of sources lists approximately 2000 worldwide), their quality can be variable at best - sometimes out of date, often with missing fields or stop data. Tools such as GTFS validators can provide some insight into the quality of a feed, although they stop short of cleaning or repairing them.
Other tools, such as Podaris can attempt to present as complete a picture of the feed as possible by using automatic street routing to effectively interpolate between stops when spatial data is missing, for example.
While GTFS is currently used by over 10,000 transit operators in more than 100 countries, this is typically on a voluntary basis. In the United States however, as of 2023, the Federal Transit Administration (FTA) has required transit agencies operating fixed or deviated fixed routes to submit valid GTFS datasets as part of their annual National Transit Database (NTD) report. Agencies must keep these feeds up-to-date and certify their validity and accuracy on an annual basis.
The FTA recognise the potential challenges, particularly for smaller agencies in complying with this requirement, and so offer a year waiver, conditional on proof that the agency is pursuing technical assistance establishing GTFS data.
Unlocking GTFS
We've spoken previously about the ease of constructing, visualising and editing GTFS feeds in Podaris. Since then, we've added even more features to help you unlock the insights within your transit feeds and use them to better understand your networks.
Once you've imported your feed via the simple drag-and-drop importer, you'll already have access to a wealth of information about your feed. The services overview tool gives you at-a-glance stats for all routes, active on a given day, on an agency-by-agency basis. Here you'll find information about the overall minimal peak vehicle requirement (PVR), revenue time and revenue distance.
You can of course explore and edit individual routes in far greater detail, should you desire. With Podaris’ services tools, you can also explore costings, view comprehensive calendar data, and understand headway and PVR on a per trip basis.
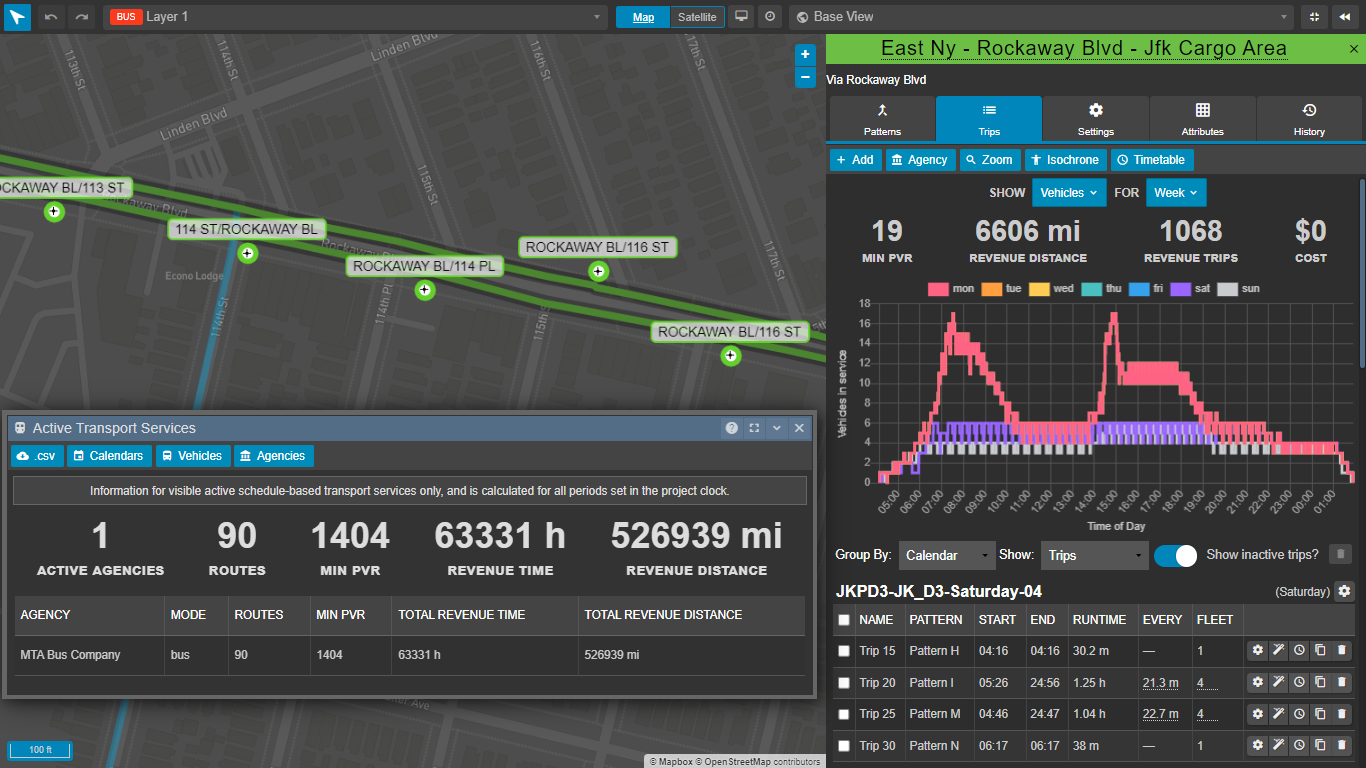
Viewing statstics on all routes, left, and an individual route, right.
A more traditional timetable/schedule view can also be generated in a single click.
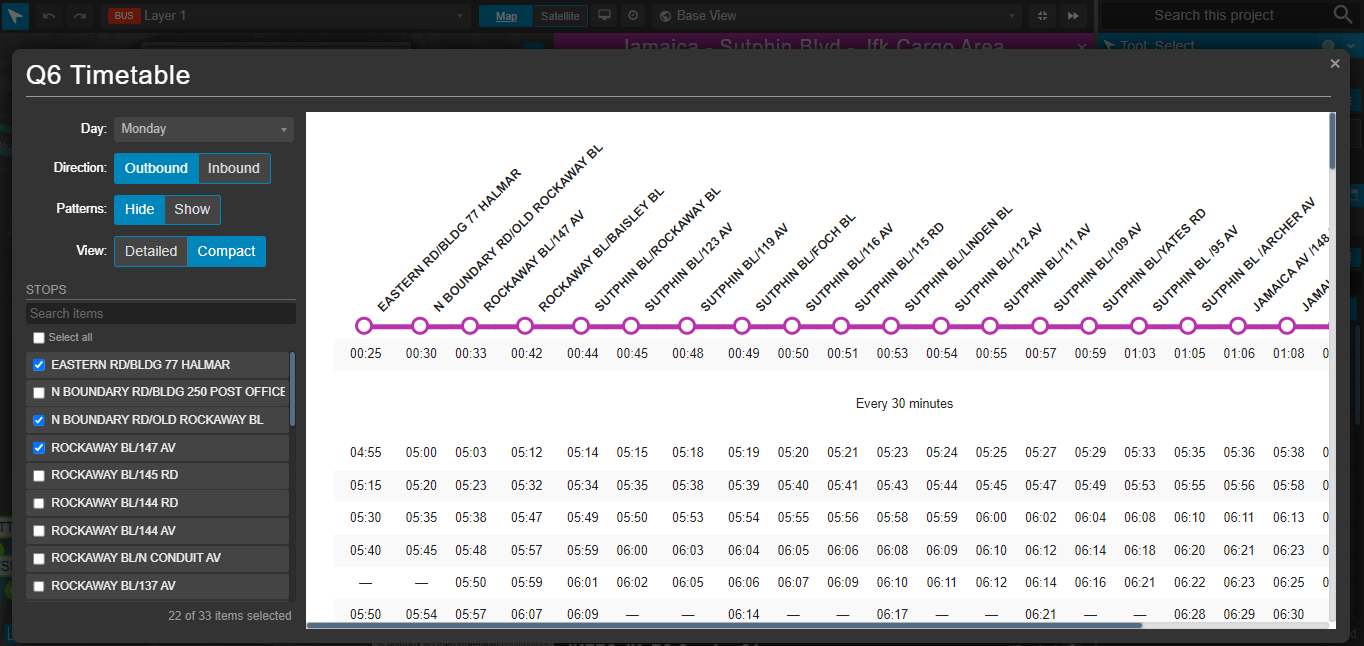
Generating timetables from GTFS feeds.
Where to begin?
Understanding when to analyse or edit, in terms of your service's calendars can be a challenging prospect when confronted with the raw data. That's why we've added the new Trips by Time tool which creates a graph of trips for all services, grouped either by week, or day. With this tool, you can easily identify which days or weeks are disproportionately served.
Once you've identified a date range to explore in this way, you can choose to constrain all further analyses (such as accessibility analysis) to that range using the project clock. When combined with demographic datasets this can help you answer questions such as ‘how many fewer people are served by available public transport options on one week versus the next?'.
Corridor frequency analysis gives you an immediate view of all services, colour coded according to peak vehicle per hour for a specified day, and the same information can be explored in a more granular fashion for each segment along a route.
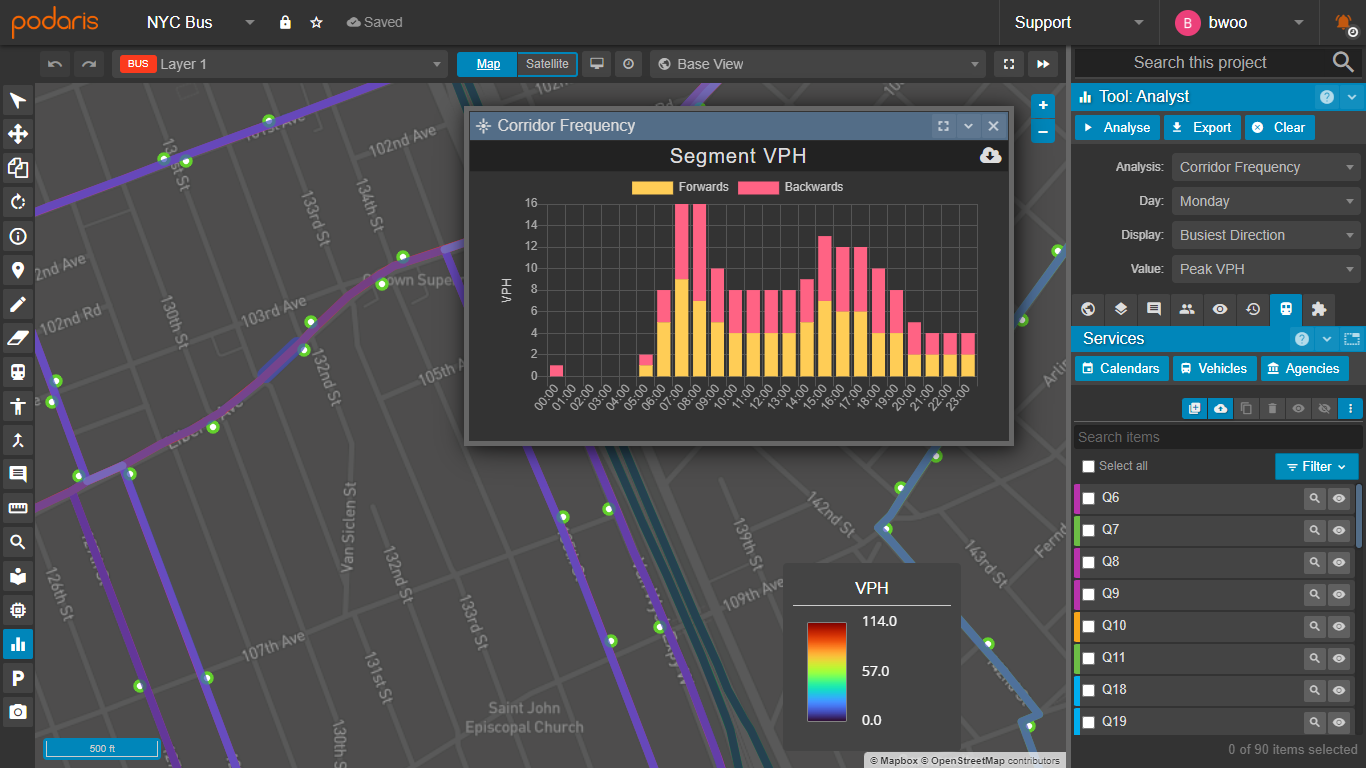
Exploring peak vehicles per hour in New York City
One aspect of editing GTFS feeds that can be particularly time consuming is the process of modifying trip times. We've brought the power of AI to transport planning in order to dramatically accelerate this process - allowing you to make changes with text prompts, such as “double the PM frequency” and “remove all trips before 12pm”.
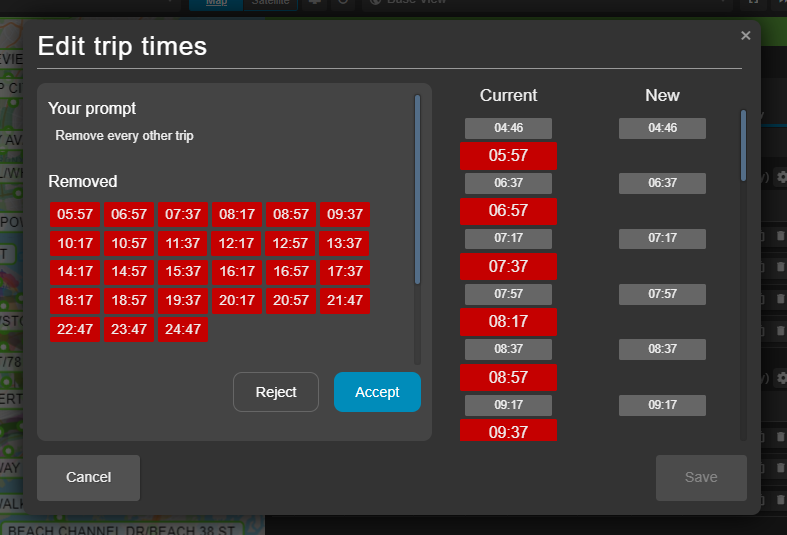
AI Powered Trip Editing in Podaris
Crucially, every field required to satisfy federal requirements for validity is editable within Podaris, allowing you to quickly edit trips, patterns (the path vehicles travel from stop to stop), calendars and more, before exporting as a valid GTFS feed.
For more information on GTFS editing and the Podaris platform, head over to https://www.podaris.com/gtfs-editing now.