A huge thanks to all of you who signed up for our recent transport accessibility analysis webinar and introduction to Podaris:Insight this November. We were delighted to see so many of you tuning in and engaging with us through a wide range of thought-provoking questions.
It's clear that accessibility analysis and transport equity are at the forefront of many planner's minds these days, although navigating and implementing the many analysis types has typically been a complex and laborious process. Which is why we created Podaris:Insight - the fastest, simplest way to create and share reliable outputs surfaced from cutting-edge accessibility analysis.
The recording of webinar is now available and it provides a concise overview of the Podaris platform, an introduction to common and emerging accessibility analysis types and some short walkthroughs, showing you how Podaris:Insight can help you better understand accessibility across your networks in minutes.
While Podaris:Insight bundles a wide range of analysis types such as Mobility Energy Productivity (MEP), stop catchment and corridor frequency in one cloud-based toolkit, we've highlighted two commonly used types in these short (~5 min) extracts.
Creating place-based isochrones
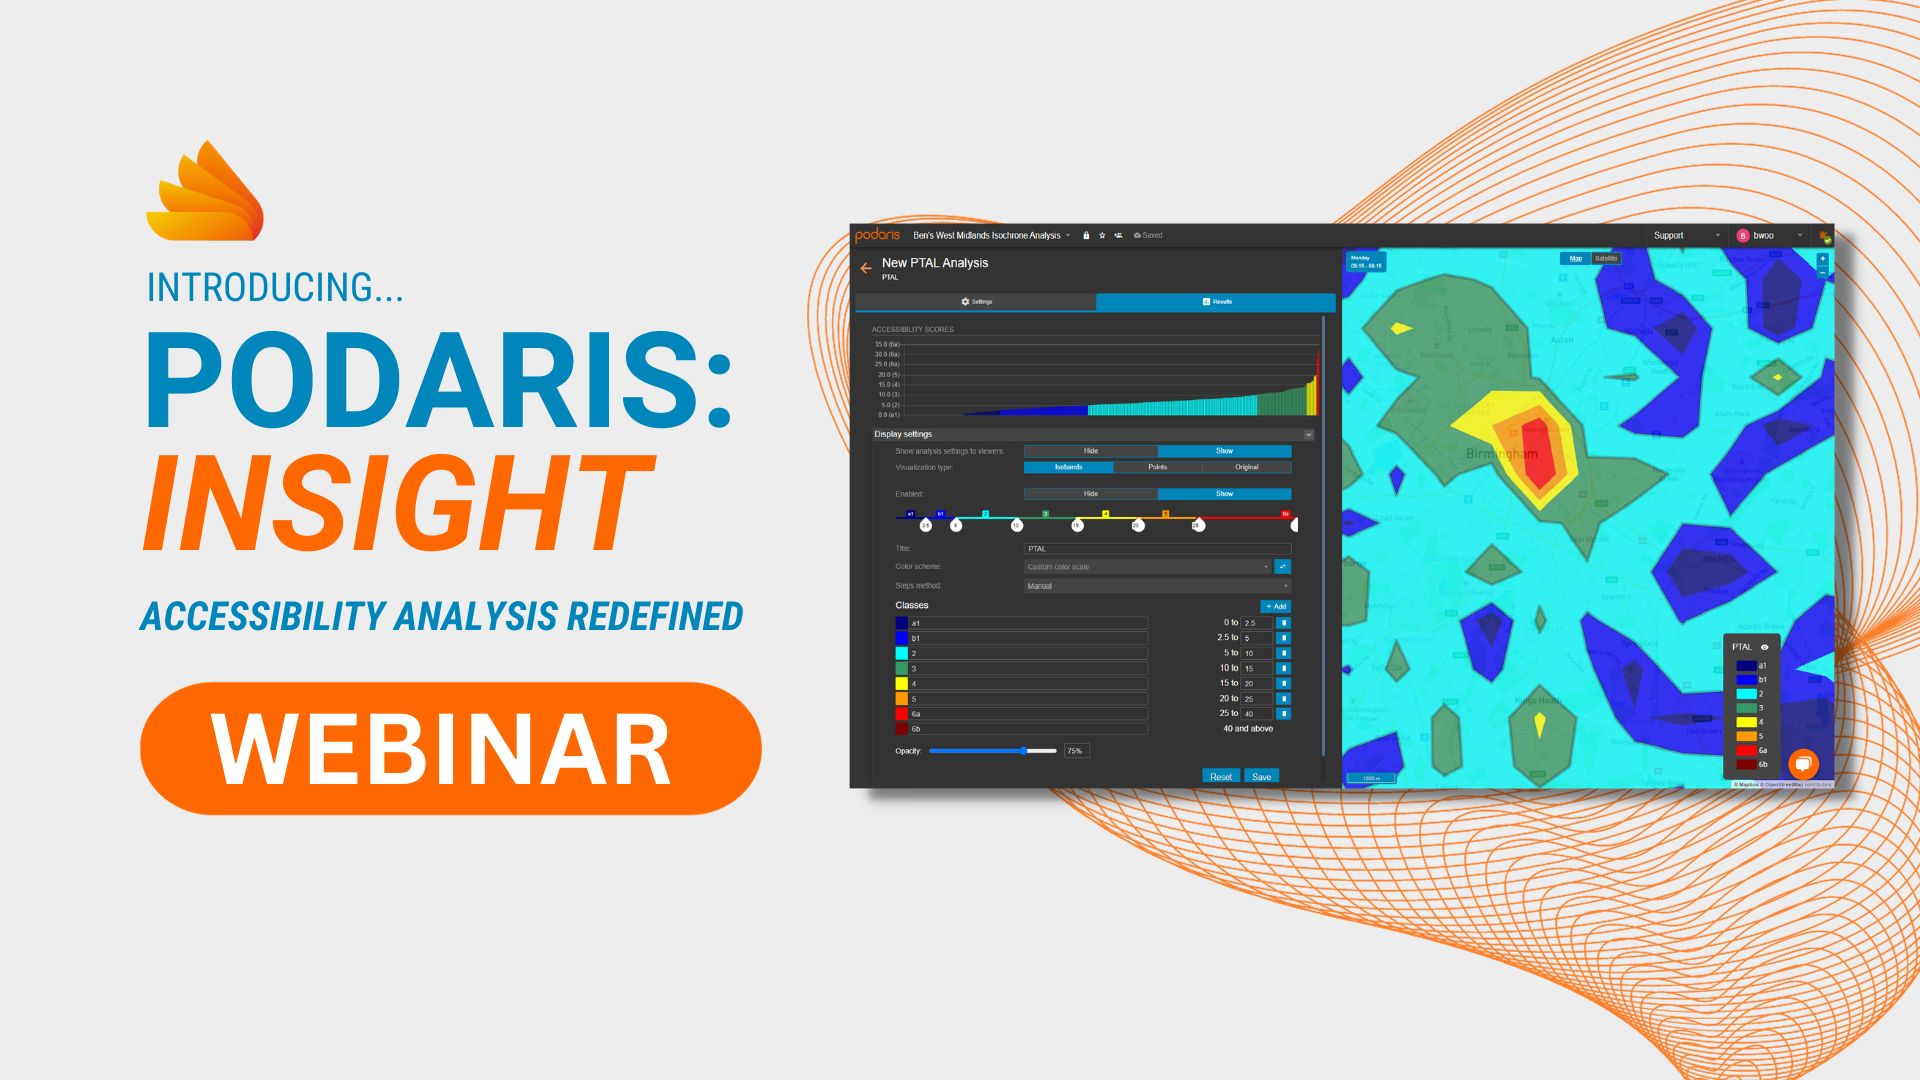
Creating PTAL scores
Questions and Answers
With so many thoughtful questions, we could not get to all of them, or for the ones answered, in as much detail as we would have liked. Below we've answered some of your questions.
If you have any questions of your own about Podaris:Insight or the Podaris platform in general, don't hesitate to reach out to us at info@podaris.com or to see Podaris:Insight in action, why not book a one-on-one demo with us today at https://www.podaris.com/schedule-a-demo
Q: What is the format of the networks produced by Podris Plan? Is it similar to GTFS?
A: Yes, Podaris:Plan can import and export common industry standard formats, such GTFS. Some Podaris users even see Podaris:Plan as a standalone lightweight GTFS editor.
Q: Does Podaris take utilization (volume of vehicles or mode share) into account to quantify system efficiency?
A: The types of accessibility analysis methods available in Podaris:Insight typically do not, but the Podaris platform also includes a demand modelling simulation engine which can be used to estimate travel demand and system load.
Q: One of the criticisms of the current PTAL is that it only measures frequency and not distance possible to travel in a given time. Can this be addressed?
A: Accessibility analysis is always a trade-off between detail and being able to quickly calculate easy to understand metrics. Since PTAL was designed at a time when available computing power and datasets meant that quick to calculate means something very different today, it might not be the best metric for your scheme.
Within Podaris there are multiple forms of accessibility analysis such as isochrones and accessibility analysis to allow you to take into account factors such as travel time as well as the level of service at stops, and we’re working to implement a number of the PTAL variants that try to address those criticisms.
Q: What I would find useful is comparing accessibility between say car, PT and bike. Is that possible?
A: Absolutely! A number of the accessibility methods available in Podaris:Insight are multi-modal, including emerging ones like MEP. However, we definitely see a gap in the space for more multi-modal accessibility methods that can be applied generally. If any practitioner would like to work with us to implement or design others, please reach out.
Q: What is the engine being used for network editing in Podaris?
A: Editing of the public transport network is through our own integrated engine – Podaris:Plan. Of course, if you want to use 3rd-party tools then you can always do that, and import the resulting files.
Q: I would like to know the number and proportion of population of a small area (eg ward, LSOA) who have access to a service (e.g. pharmacy) or town centre within a certain time limit (eg 30 minutes). Can this be done?
A: Yes this can be done easily in Podaris with isochrones for a range of modes (walking, cycling, public transport, car). Isochrone analysis allows you to quantify the number and proportion of your population that are able to access points of interest (uploaded as datasets) for multiple duration contours per isochrone (e.g. in bands of 15, 30, 45 minutes)
Q: Is it possible to analyse the impact of increasing the population in a particular location?
A: You can add different population datasets to represent multiple scenarios and analyse both of these within the same analysis allowing you to see the impact.
Q: Public sector clients have their PT networks managed, to ensure accuracy. On a project basis, can these PT networks be shared with their consultant - to ensure accuracy and save time?
A: Yes, projects within Podaris can be shared with different users and they can collaborate in real-time as well as a Google docs. Edits can be seen by all users and verified in the History panel of Podaris:Plan project. Users can come from multiple organisations or agencies, so we often see local authorities and their consultants working on the same platform instance together. This kind of collaboration has been one of the key things we've focused on since the very beginning of Podaris.
Q: Can this be applied to shared mobility schemes (E.g. bike hire scheme) based on docking stations?
A: Yes definitely! For example you could use it to quickly analyse the accessible population / jobs / etc. around docking stations.