This week we’re going to lift the veil a bit and show some of the advanced capabilities that we’re working on bringing to Podaris. One feature that we’re particularly excited about is “advanced isochrones”. This combines our longstanding isochrone calculations with new datasets functionality, making Podaris more powerful than ever before for demographic analysis.
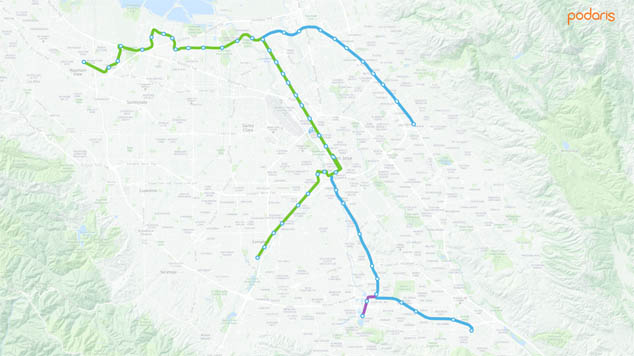
First, let’s start with an existing transport system – in this case, the Santa Clara VTA light rail system:
Wouldn’t it be nice to understand exactly how this system impacts the community? Here’s one way you could do that.
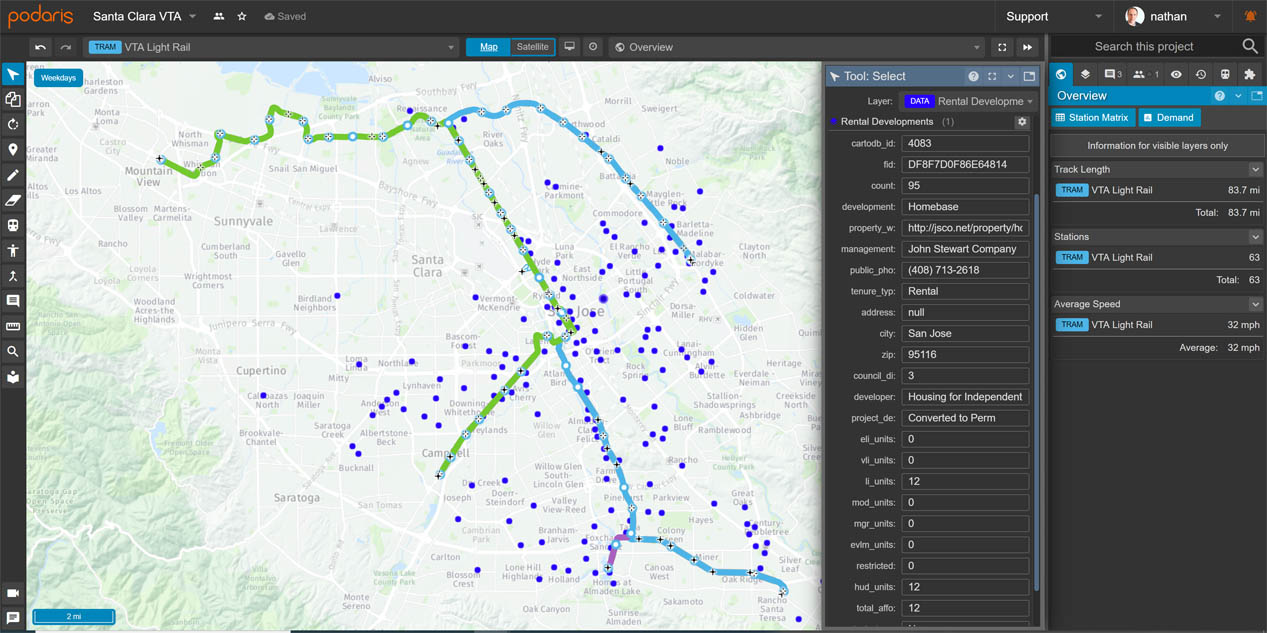
First, we found a public dataset of low-income housing units, which could be imported as a CSV into Podaris. Note that this retains all the metadata from the source dataset, as you can see from the attributes shown for the selected point:
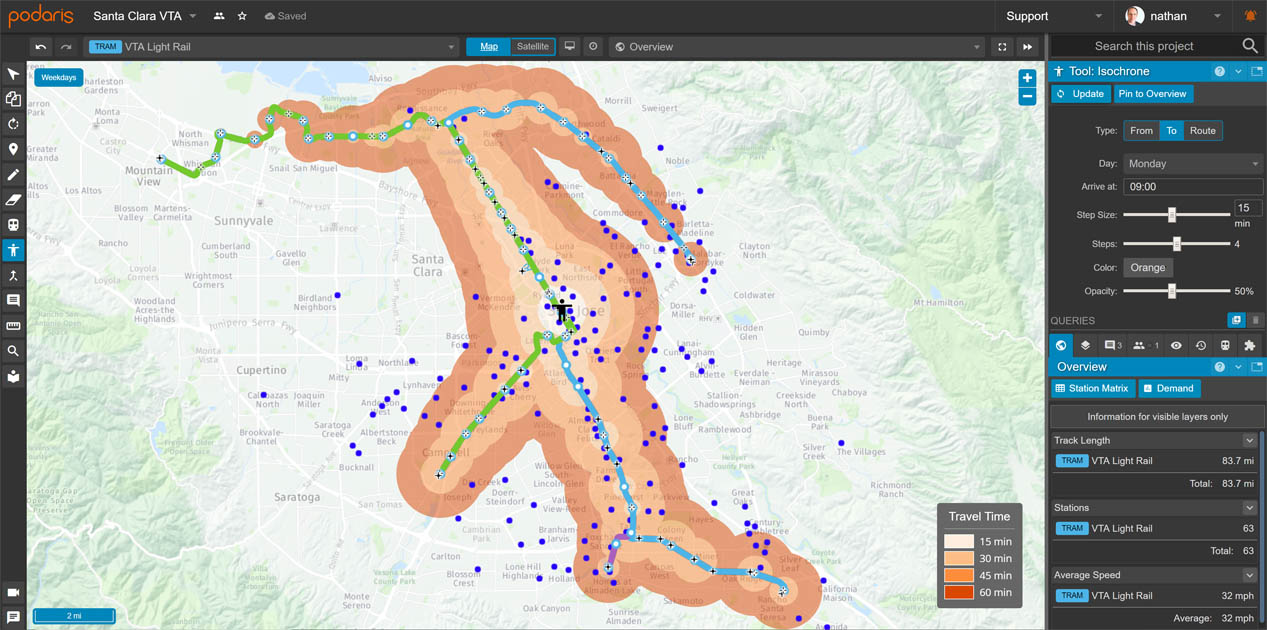
Now let’s do use the isochrone tool to show how the travel-time in this network relates to the distribution of low-income housing. Note that the isochrone includes some new controls:
“Type” allows you to specify whether you are interested in accessibility from a single point, to a single point, or along an entire route. “Day” specifies the day that you’re interested in travelling. (Why does this matter? Because soon we’ll support detailed service schedules! But that’s a topic for another post.) “Arrive at/Depart at/Route” allows you to specify further details, according to the needs of the “Type” above.
In this case, we want to know how many low-income housing units can reach the centre of San Jose by 9am on a Monday morning. This is what it shows us:
Visually, that’s a nice result, but it hasn’t actually answered our question: exactly how many housing units are reached? To do that, we can add a “query” to the isochrone, instructing it to aggregate values based on the underlying data:
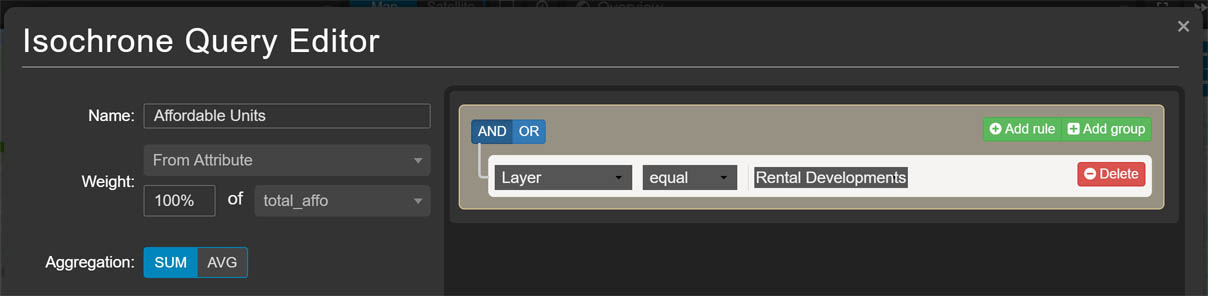
(This query functionality is, frankly, a mind-bogglingly powerful tool for demographic analysis of transport systems and you will soon see it popping up all over Podaris.)
After adding the query, we can now see the following:
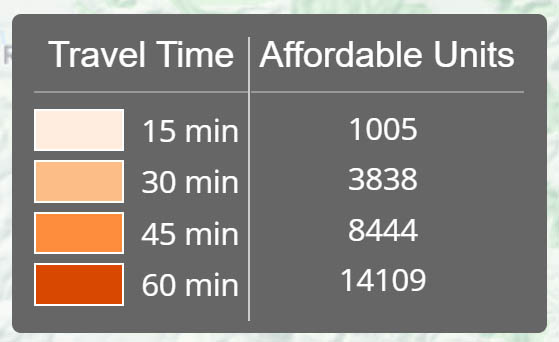
There’s your exact answer, quick and easy!
Of course, Podaris isn’t just here to help you understand how existing transport systems work. It’s here to help you understand how they can work better. What if we wanted to expand the Light Rail network by adding another route? In a matter of minutes, you can draw a new route and see how that compares:
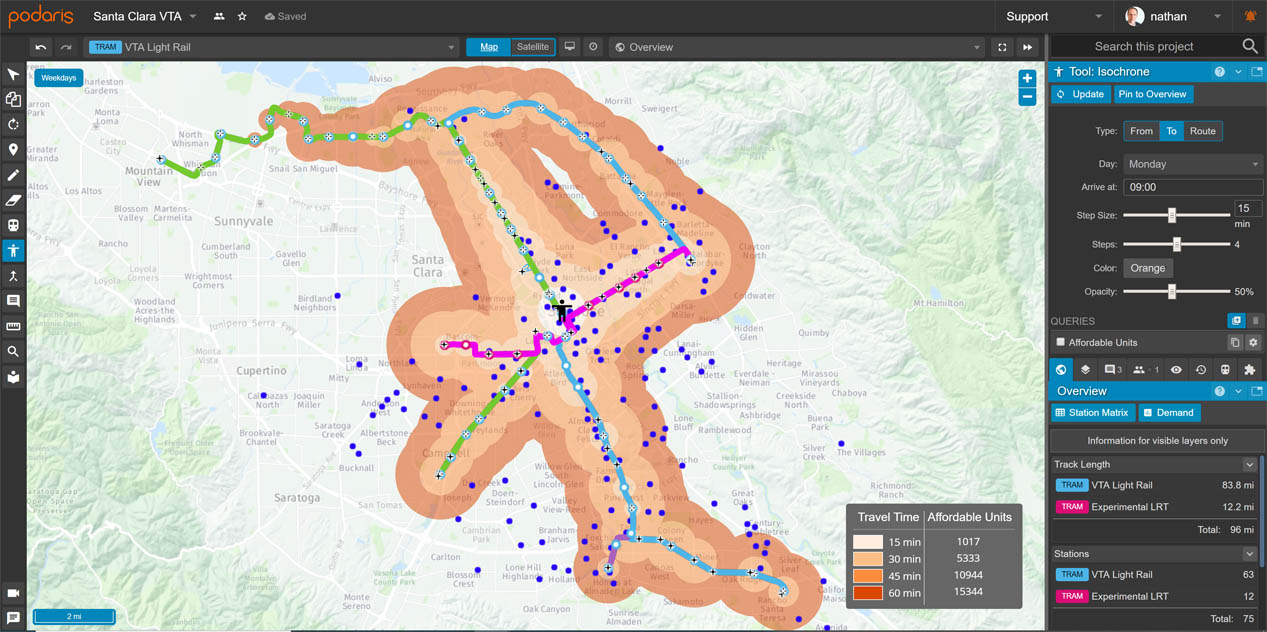
This shows us in some detail how we can increase low-income access to the city centre. By adding another 12 stations and 12.2 miles of track, we can increase the number of low-income housing units within 30 minutes of downtown by 1,495 units.
But that’s just the accessibility to a single location. What kind of coverage does this new route enable as a whole? Using the “Route”-type isochrone, we can instantly get the answer:
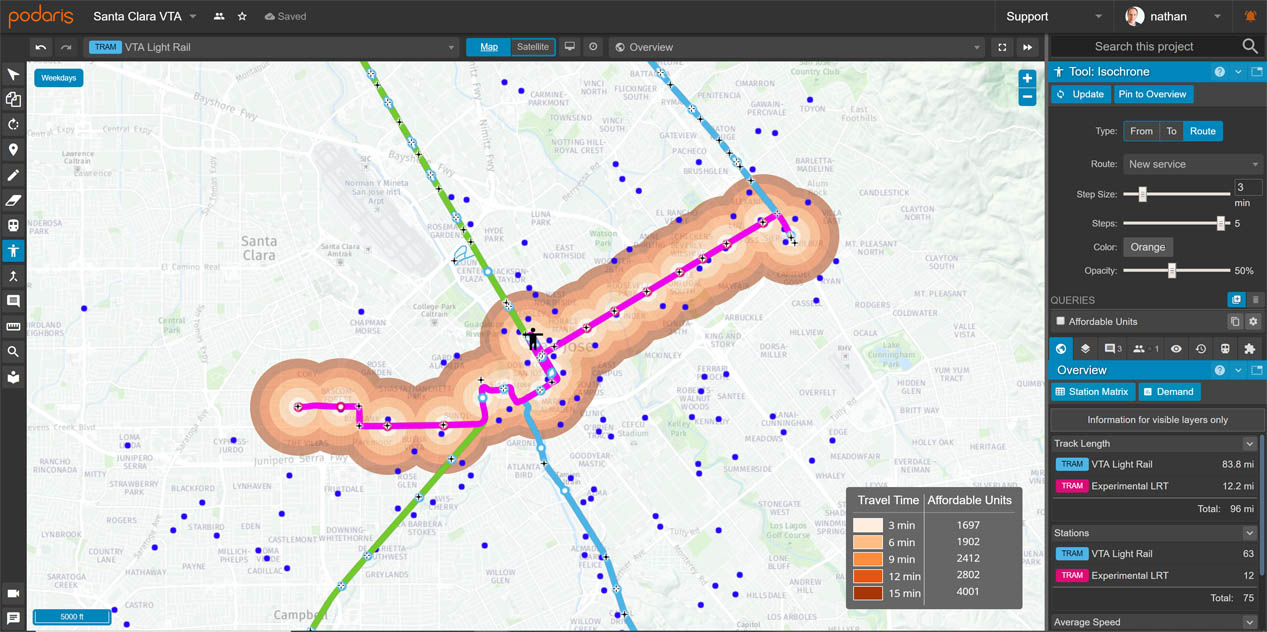
Our new proposed route has 4,001 low-income units within 15 minutes of a stop, and is practically on the doorstep of 1,697 units.
From start to finish, this entire modelling and analysis exercise can be done in well under an hour. These kinds of analytical capabilities should make Podaris far more useful for many different types of transport planning studies.
We expect that our advanced transport isochrone features will go live within the next few weeks, and will let you know when it’s ready.
In the meantime, let us know how you’d make use of a feature like this! We want to make sure that Podaris works for your use-case, and is compatible with all the datasets and analytical tools that you use. We’re conducting a survey to better understand how you use (or would like to use) Podaris – why not take a few minutes to fill it out? Have more detailed feedback? Tell us about it by writing to info@podaris.com
What we're reading
Here's a selection of articles that caught our eye this August. Found something that you think deserves our attention? Send us a link!
- Future of Streets: Los Angeles studio
- How Sunday Became the Safest Day in Bogotá
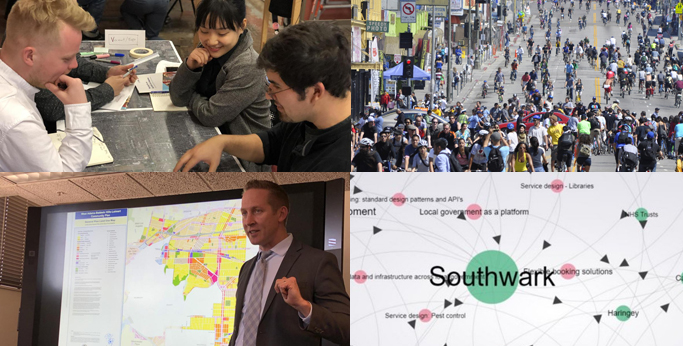
- What I learnt in Southwark and collaborating in local gov