Datasets in Podaris:Plan
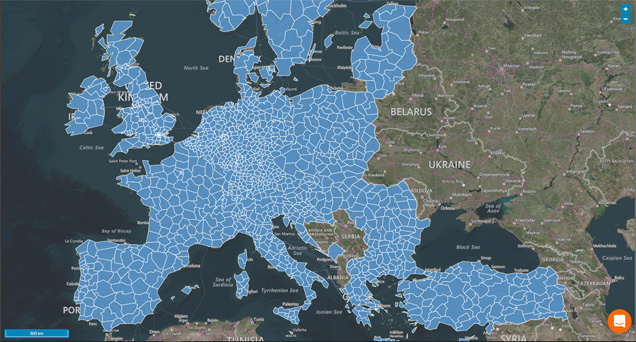
We've recently spoken about how you can use Tilesets to show raster data in Podaris:Plan. Today we're excited to announce datasets - a way to work with custom vector data. Each dataset is its own layer in Podaris:Plan, meaning that you can easily switch between layers for buildings, demographic statistics, or anything you choose.
Extensive styling options give you full control over each layer's look, allowing you to craft the perfect presentation of your datasets for use in Podaris:Engage.
Analyse Demographic Statistics
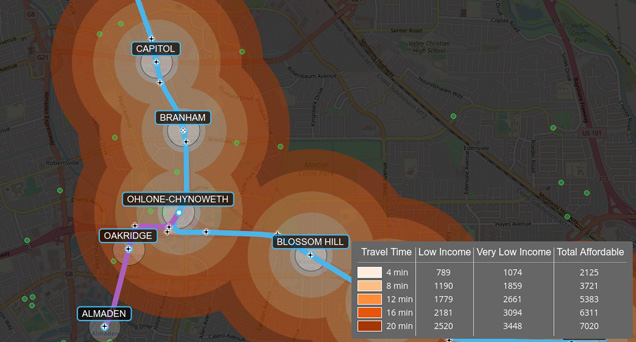
Soon you will able to easily combine datasets with the networks in your project to rapidly quantify connectivity changes, helping you answer questions such as:
- How many people live within 10 mins of stops along a bus route?
- How many more low income units does Scenario A provide connectivity to compared to Scenario B?
- If I move our office to location X, how many employees can reach it in 15 mins? 30 mins? 45 mins?
This functionality is currently in beta. If you would like early access, please get in touch.
Importing and drawing datasets
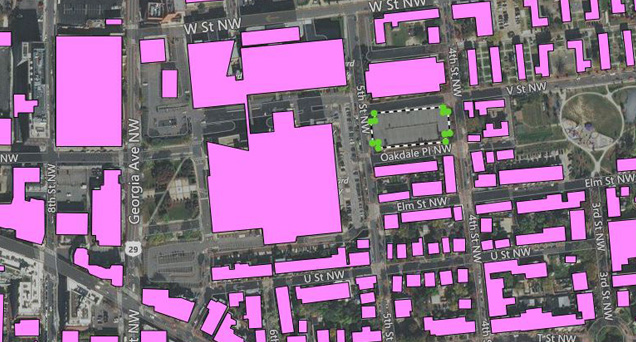
Datasets can be imported from industry standard formats, such as GeoJSON and CSV. Currently, points, lines, and polygons are the supported geometry types.
Each feature can contain custom attributes which can be used for connectivity analysis, demand scenario creation, and much more! For example, using attributes to define a building's name and maximum occupancy. When importing an existing dataset, you can decide which attributes to bring into your project and which to discard.
If you're drawing your own features, you have full control over each point, line and polygon and can adjust each one freely on your map by hand.
Datasets are available to use in Podaris:Plan right now. You can dive straight in, or use our online help to get started!