The road to post-pandemic recovery has been challenging for Local Authorities and operators delivering bus services across the UK. Back in March 2021, the UK Government's Bus Back Better strategy outlined the situation in the following terms:
“Bus use has held up more strongly than rail in the pandemic, but as with the railways it has accelerated the challenges to an operating model that was already in trouble. Few services could now survive without emergency state support. If we are not to abandon entire communities, services cannot be planned purely on a commercial basis.”
That document contained a spending plan for £3bn of funding for buses, announced just over a year earlier and concluded with a call for all Local Transport Authorities (LTAs) to publish local Bus Service Improvement Plans (BSIPs) by October 2021. Ultimately, that £3bn would shrink to £1.4bn, and only 40% of LTAs would receive any funding at all. Those that did, received on average less than a quarter of what they had asked for.
COVID-19 related emergency funding, from the Bus Service Support Grant, and Bus Recovery Grant, to the Bus Recovery Grant Extension (now extended to March 2023), have sought to offer essential support during the pandemic. During the last year, Podaris has worked closely with a number of LTAs, to become the tool of choice in preparing BSIPs and the Bus Network Reviews (BNRs) required to apply for the final tranche of recovery funding. Within these BNRs, the Government required that LTAs and operators outline how they would facilitate the creation of stable and resilient networks once funding had ceased.
The reality today, as described by Campaign for Better Transport is of hundreds of cuts and reductions to services in the last few months, resulting from “bus operators … struggling with lower demand on some routes, severe driver shortages, and fuel costs.". It also states that “local authority budgets are … under severe strain, and many cannot afford to support services.” In their pre-autumn statement letter to the UK Chancellor, Campaign for Better Transport presented an impassioned plea to the Government to show its full support for local bus services, in order to reduce social isolation, reduce emissions, promote levelling-up and ultimately boost the economy.
“The biggest cuts in a generation”
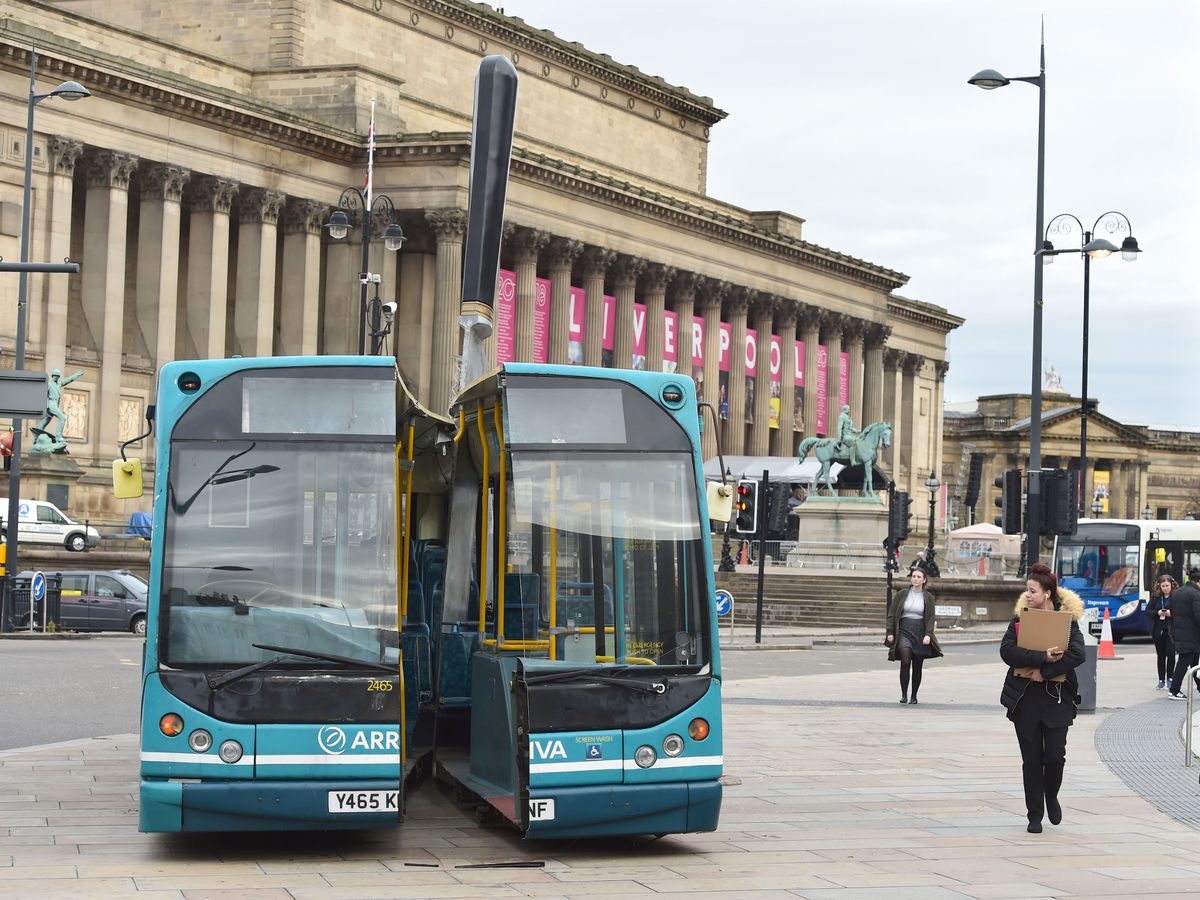
Dramatic cuts to buses across the UK
Dramatic, headline-making cuts have made waves across the country this year, with South Yorkshire Mayor Oliver Coppard warning of the biggest cuts to services “in a generation” back in June, and Forest of Dean Councillor Chris McFarling announcing that Stagecoach's 150,000 lost bus journeys in Gloucestershire would result in rural residents becoming “prisoners in their own homes” this November.
Similarly, in Cambridgeshire, 18 routes have been excluded in a network revised for October, and Stagecoach East have conceded that even on services with increased use (which will remain) operating these services is “still challenging even with central Government funding”.
So how best to appraise which services are most valuable, when cuts are an unfortunate financial necessity?
Podaris is an online platform for high-level planning and analysis of multimodal transport networks, designed to create accurate, indicative outputs from rapidly modelled scenarios. For those planning alterations to bus services, this means the ability to quickly and easily ingest your GTFS and TransXChange feeds, explore accessibility and travel times across your network, and quickly understand factors such as service frequency along route segments.
At a time when LTAs and operators are facing such significant financial challenges, augmenting their toolkits with new transport planning software might seem counterintuitive. But now is precisely the moment to explore the potential of cost-effective solutions such as Podaris, and find new ways to optimise and adjust services in order to save money and reduce cuts. In the instances where cuts are a painful and inevitable fact of life, Podaris can help surface the most equitable solutions to reducing services.
A toolkit for rapid, data-driven decision-making
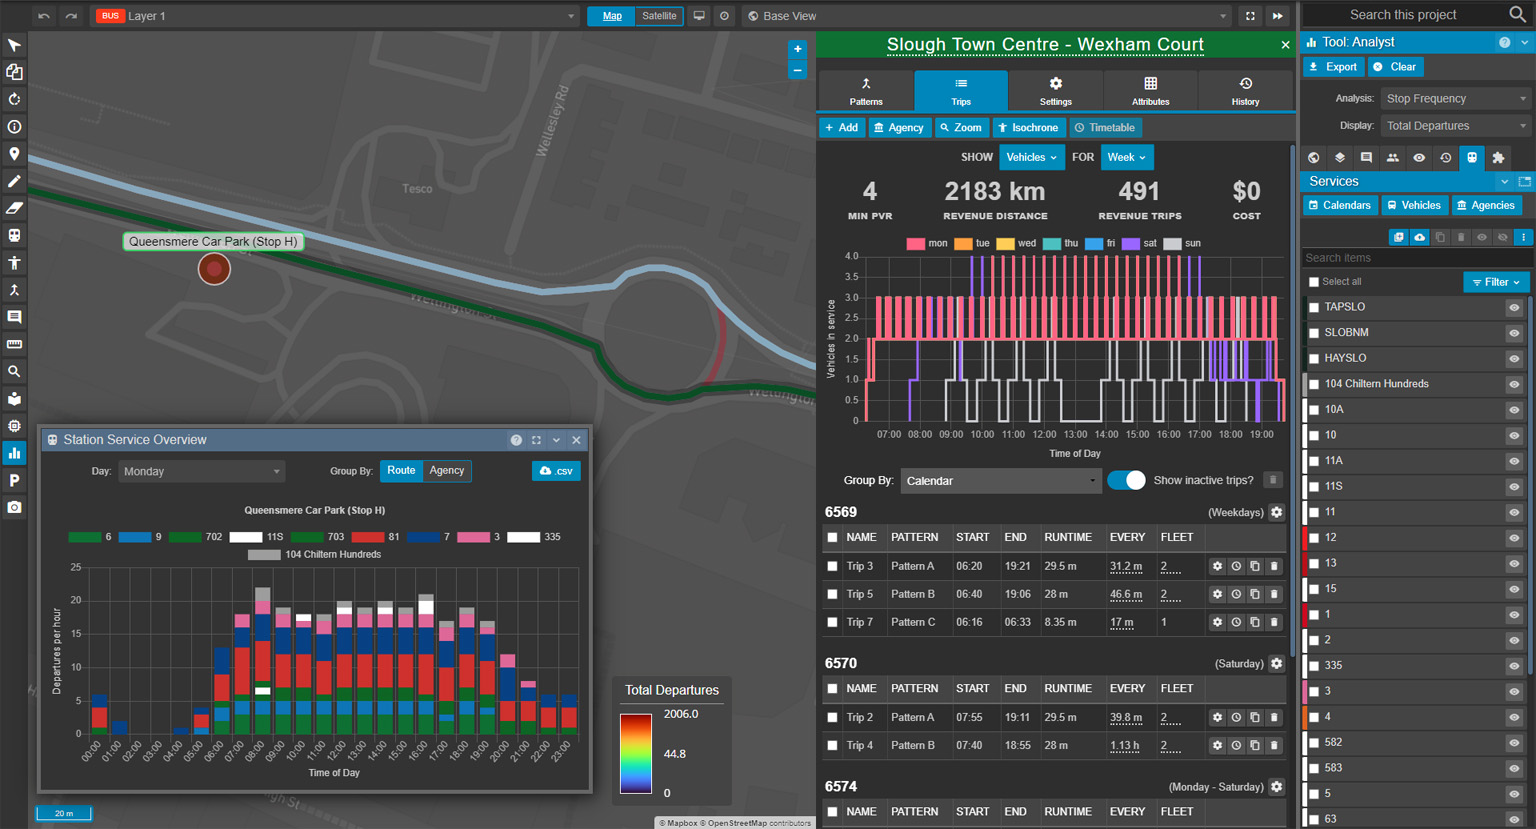
Route statistics and departures per hour for a stop in Podaris
Within the platform are a suite of analysis tools for better understanding your services at-a-glance and surfacing insights from the underlying data. Stop frequency tools enable you to clearly visualise departures per hour across a given day, on a route or agency basis at any given stop. ‘Heat-map’ style colour styling indicates which stops on your network operate with higher or lower numbers of total departures, helping you to identify the most heavily used parts of your network.
These represent a small subset of the collaborative toolkit that comprises the Podaris platform. By importing regional demographic data, for instance, and exploring the comparative effects of alterations to your services on access to essential services, you can quickly understand the real-world impact of reducing services on communities. The data-driven decisions that you make about proposed alterations can then be presented to your stakeholders via an integrated engagement application, allowing community members to respond to your plans with comments pinned to your maps, engendering buy-in.
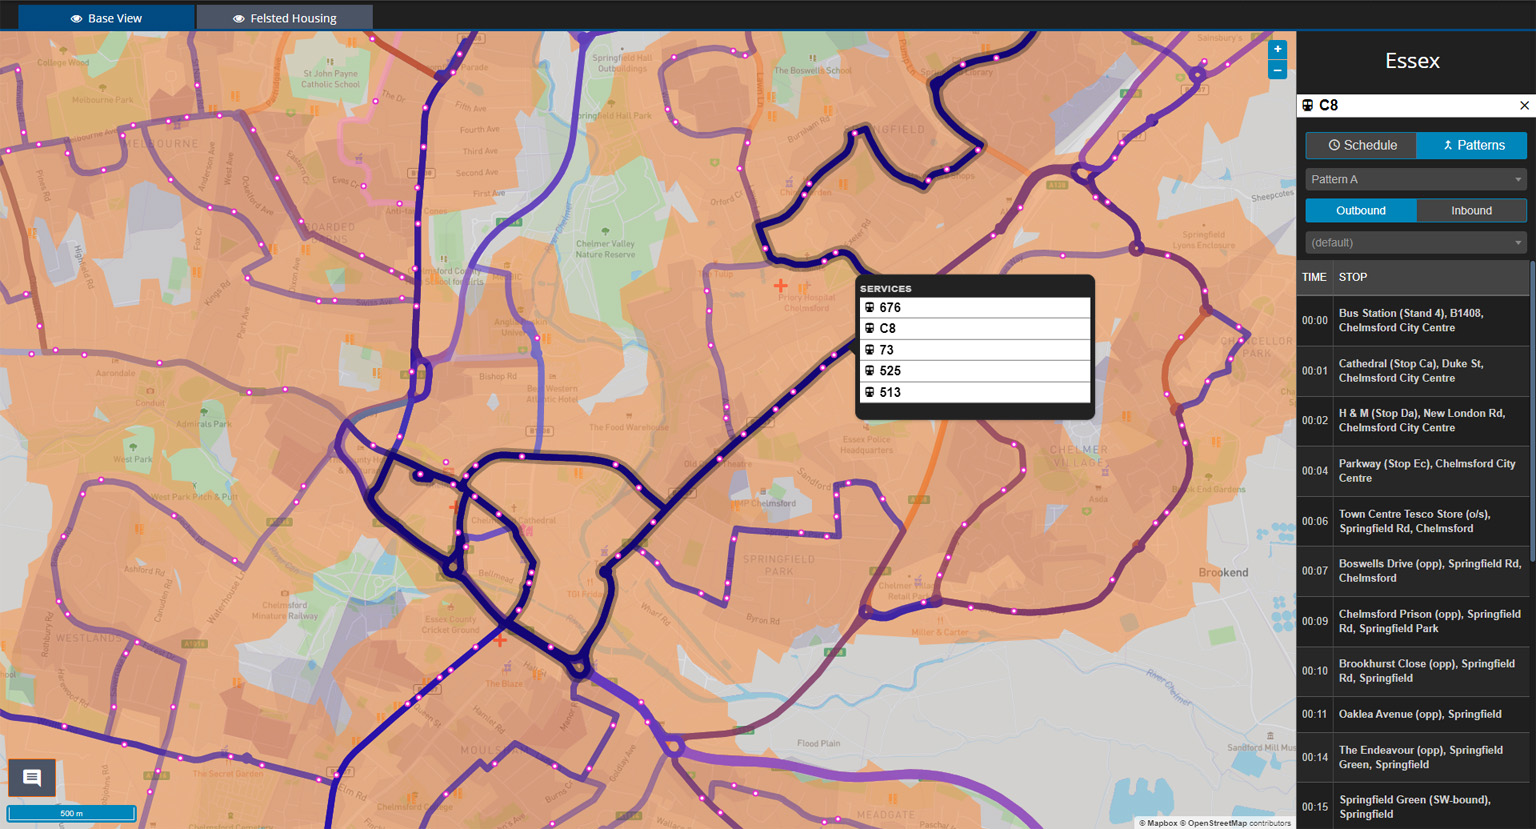
Networks can be displayed on simplified, interactive maps for stakeholder engagement and comment
Existing services can be better understood by means of Podaris’ built-in demand modelling simulator, which can be used to create accurate, agent-based simulations of trips across your network in minutes. From here, the Analyst Tool can be used to surface key metrics from your simulations, such as boardings and alightings for stops along your routes. These simulations may, for example, be constructed around demand scenarios that model trips by a population to hospitals across your network on a given day. Understanding which stops are most heavily used in such a context may then assist in prioritising which stops and services are reduced or maintained.
Within Podaris, all metrics are instantly recalculated once a route pattern is redrawn, fleet size is modified, or trip times are altered. This includes operating costs, which can be easily compared between existing and proposed service schedules. We've spoken recently about how Podaris can be used to explore the impact of fare strategies, from flat fares to zonal pricing - all of which can also be modelled in the context of existing services or proposed alterations.
Ultimately, the cutting of services is a delicate matter that necessitates the weighing of a large number of financial and social factors. The true effects of service alterations on a region can be better predicted with both high quality data and tools that intelligently create rich insights from that data.
To discover how Podaris can help you make the best choices for the future of your services, schedule a demo with us today.